
Retail and consumer businesses don’t lose money because they lack dashboards—they lose money because critical decisions are made on stale, inconsistent, or incomplete operational data. We built a near real-time reporting layer that unified corporate and retail operations metrics—profitability by region and store, daily inventory and POS visibility, and delivery status tracking—so leadership could act daily with confidence and scale operations based on facts, not gut. We extended this foundation with demand forecasting to anticipate stock needs, automated reorder recommendations to act on those forecasts, and a prioritized alerts engine to surface critical exceptions before they become revenue problems.
At a glance:
- Industry: Retail / Consumer brands
- Core problem: Decision-making was slowed by delayed, fragmented operational reporting—with no forward-looking demand visibility, no automated reorder triggers, and no alert layer to catch emerging issues
- What we delivered: Near real-time reporting + demand forecasting + inventory reorder recommendations + automated alerts across profitability, inventory, POS, and delivery operations
- Primary impact: Faster issue detection, stockout prevention, reduced overstock risk, improved operational execution, and data-backed expansion planning (e.g., warehouse footprint decisions)
- Core stack: OneLake (storage), Fabric Warehouse (analytics), Power BI (reporting)
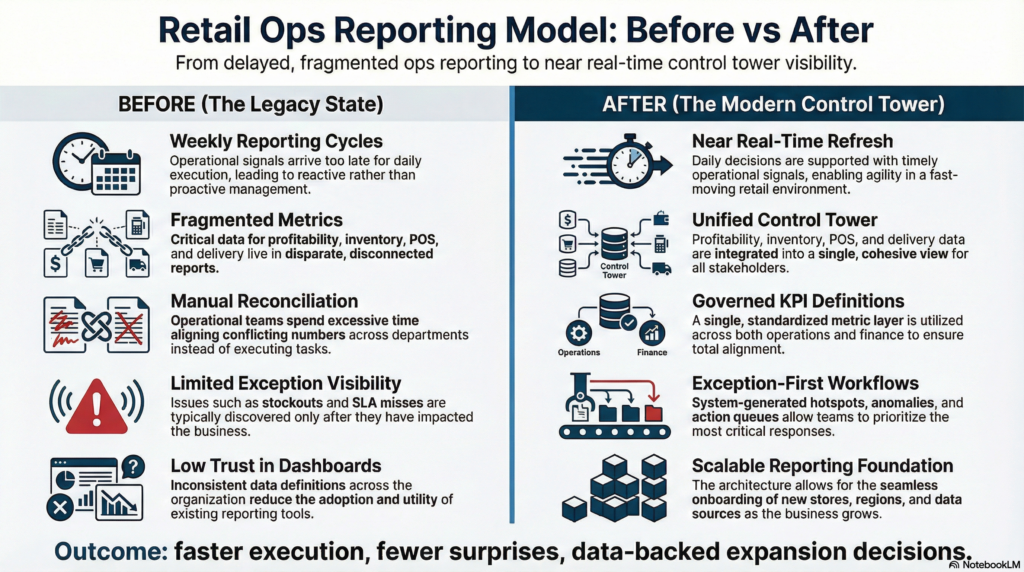
The challenge: the business ran daily—but reporting ran weekly, with no forward view
Corporate and retail operations were generating huge volumes of signals (sales, inventory movement, fulfillment, delivery updates), but the reporting layer couldn’t keep pace. Teams were forced into manual reconciliations, different versions of the truth, and delayed insights—creating a consistent lag between “what happened” and “what the business did about it.” Beyond the reporting delays, teams had no forward-looking view—there was no way to predict stockouts before they happened, no automated trigger to initiate reorders, and no alert layer to surface emerging inventory or delivery issues without someone manually digging through the data.
What we set out to solve:
- Unify corporate and retail operational reporting into a single decision layer
- Provide profitability insights by region and store (not just revenue)
- Enable daily inventory and POS reporting to spot stock and sales anomalies early
- Track delivery status and fulfillment execution for operations follow-ups
- Standardize KPI definitions so every function reads the same numbers
- Surface demand forecasts to predict stock shortfalls and overstock risks before they occur
- Enable exception-first alerts so store and ops teams are notified of critical issues (stockouts, delivery SLA breaches, demand anomalies) without manual monitoring
- Trigger reorder recommendations automatically based on forecast signals, safety stock levels, and lead times
- Make the reporting reliable enough to support expansion decisions (not just monitoring)
“If your operations run daily but your insights arrive weekly, you’re managing yesterday’s problems.”
What “good” looked like (success criteria)
We aligned on outcomes that a COO/Head of Ops would care about: daily visibility, trusted KPIs, actionable exception handling, and forward-looking intelligence. The system needed to work for leadership (macro performance) and store/ops managers (micro execution).
Success criteria:
- Daily cadence: Near real-time refresh for core operational KPIs
- Trust: One metric layer and consistent definitions across functions
- Actionability: Exception-first views (what’s off, where, why it matters)
- Coverage: Profitability + inventory + POS + delivery execution in one workflow
- Scalability: Able to scale across stores/regions and add new sources without rework
- Forecasting accuracy: AI-driven demand projections close enough to actual demand that teams trust and act on them
- Reorder automation: Reorder suggestions generated automatically with AI logic breakdown, visible financial impact, and one-click approval workflow
- Alerts that act: Exception alerts ranked by financial impact, assigned to owners, with recommended actions (e.g., “Immediate reorder required,” “Consider markdown,” “Set safety buffer”)
Solution overview
We implemented an “operations control tower” reporting system: data lands into OneLake, curated and modeled into an analytics layer (Fabric Warehouse), and served to business users via Power BI dashboards built around daily operational decisions. The emphasis wasn’t visuals—it was governed KPIs, near real-time refresh, and exception-driven workflows that teams could act on. Beyond the control tower layer, we extended the system with a forecasting engine that generates AI-driven demand projections, a reorder recommendation module that translates those forecasts into actionable replenishment decisions, and an alerts & exceptions surface that prioritizes issues by financial impact and routes them to the right owner.

1. Data foundation for near real-time reporting (OneLake)
We established a unified landing zone in OneLake so operational data could be standardized and refreshed frequently. This removed “multiple sources, multiple truths” and created a foundation where operational and financial metrics could be reconciled consistently—and where forecasting models could be trained and updated against a clean, governed data layer.
2. Analytics warehouse built for operations + finance alignment (Fabric Warehouse)
We modeled the data into an analytics layer that supported both operational drilldowns and executive-level rollups. This included profitability views by region/store, daily inventory snapshots and movement signals, POS performance, delivery status tracking, and the demand history required for accurate forecasting—built in a way that stays performant as volumes scale.
3. KPI governance + metric consistency (the part that makes BI “decision-grade”)
Instead of letting every dashboard define KPIs differently, we established a governed metric layer: clear definitions, dimensional consistency (store/region/time/product), and validation checks. This reduced stakeholder debates and made reporting dependable enough to drive operational actions—including reorder approvals and alert escalations.
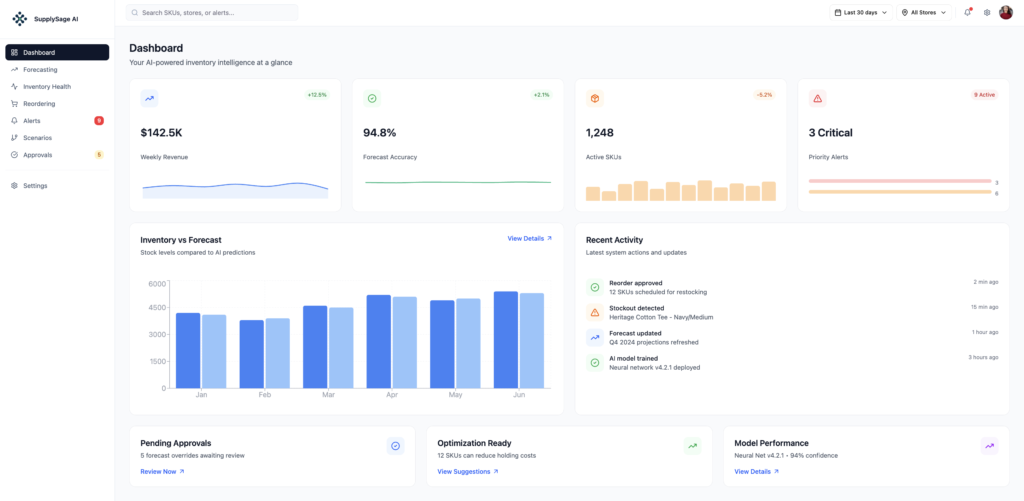
4. Operations dashboards in Power BI (control tower + drilldowns)
We delivered dashboards designed around daily decisions:
- Leadership control tower (macro trends + exceptions)
- Region/store drilldowns (local performance and issues)
- Inventory health views (stock risk and movement)
- Delivery and fulfillment status (execution bottlenecks and delays)
- Demand forecasting views (AI-driven projections, accuracy tracking, scenario modeling)
- Reorder recommendations dashboard (SKU-level replenishment actions with AI logic breakdown and approval workflow)
- Alerts & exceptions queue (prioritized by financial impact, with owner assignment and recommended actions)
This made the reporting layer practical for daily ops—not just end-of-month reviews.
5. Demand forecasting layer
We built a forecasting engine that generates AI-powered demand projections by SKU, store, and region. The module tracks forecast accuracy, shows inventory vs. forecast comparisons over time, surfaces SKUs where holding costs can be reduced, and flags model performance metrics so teams know when forecasts are reliable. Pending approvals for forecast overrides are managed in a governed workflow, ensuring human judgment stays in the loop.
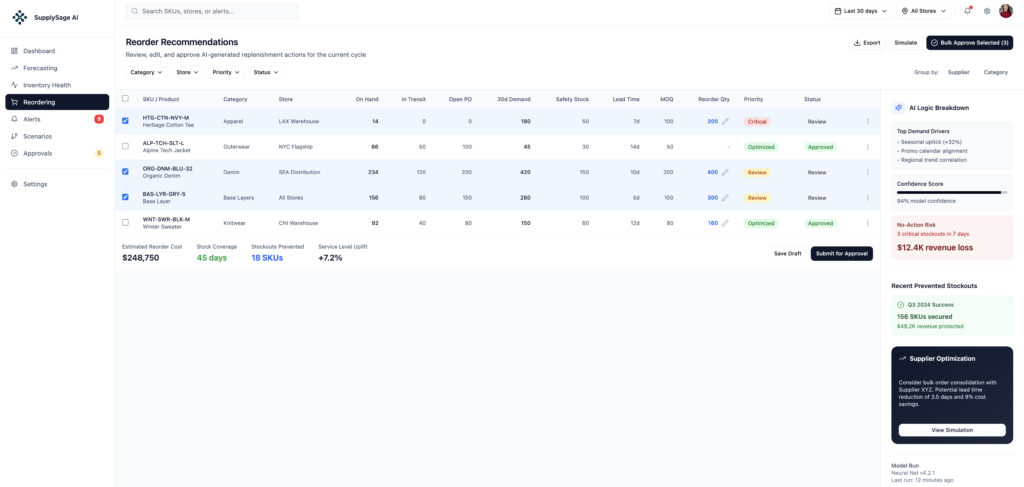
6. Reorder recommendations & approval workflow
We implemented an AI-generated reorder recommendations module that translates forecast signals into concrete replenishment actions. Each recommendation shows on-hand, in-transit, open PO, 30-day demand, safety stock, lead time, MOQ, suggested reorder quantity, and priority status (Critical / Review / Optimized / Approved). An AI Logic Breakdown panel explains the top demand drivers (seasonal uplift, promo calendar alignment, regional trend correlation), confidence score, and financial risk of inaction. Teams can bulk-approve, simulate scenarios before committing, or export—all within the same governed workflow.
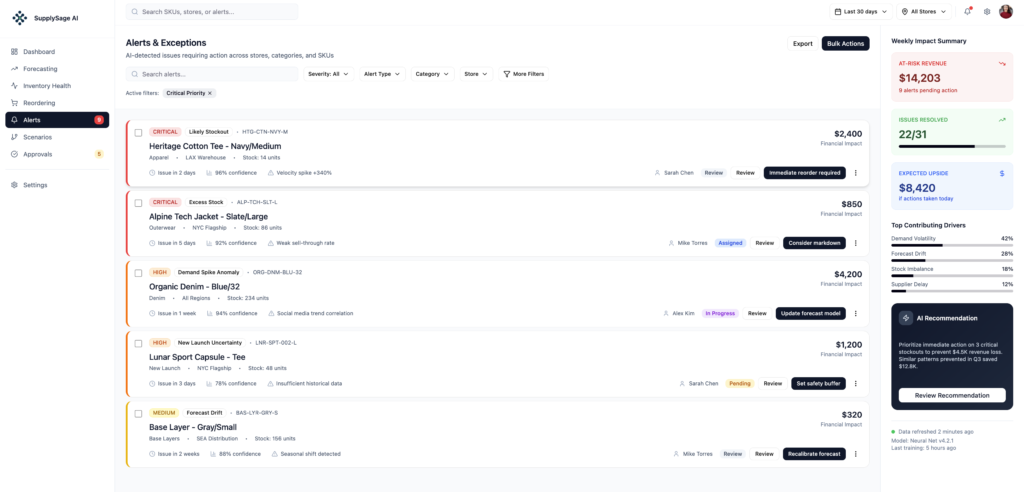
7. Alerts & exceptions engine
We added an Alerts & Exceptions surface that surfaces AI-detected issues requiring action across stores, categories, and SKUs. Alerts are prioritized by severity (Critical, High, Medium) and financial impact, assigned to owners, and include recommended actions (Immediate reorder required / Consider markdown / Update forecast model / Set safety buffer / Recalibrate forecast). A Weekly Impact Summary panel shows at-risk revenue, issues resolved, and expected upside if actions are taken today—making the alert layer directly tied to business outcomes, not just notifications.
Implementation playbook
We delivered this in a phased approach to reduce disruption: lock KPI definitions first, establish the near real-time data flow, build the warehouse model, roll out dashboards with validation and adoption loops, then layer in forecasting, reordering, and alerts.
- Phase 1: Discovery + KPI alignment — define “profitability,” inventory signals, POS metrics, delivery states, forecast inputs, alert thresholds, and owners
- Phase 2: Data foundation — OneLake ingestion + refresh cadence + quality checks
- Phase 3: Warehouse modeling — Fabric Warehouse schema + governed metric layer
- Phase 4: Reporting + adoption — Power BI dashboards, exception alert configuration, reorder approval workflow setup, validation, and training
- Phase 5: Ongoing support and enhancements — forecasting model retraining cadence, alert threshold tuning, and reorder logic refinement
Example of what you would get
Impact
- Faster operational decisions due to near real-time visibility instead of delayed reporting
- Better profitability management through region/store-level transparency
- Improved inventory execution with daily stock and POS signals (fewer surprises)
- Stronger delivery oversight via clear execution and status tracking
- Data-backed expansion planning (reporting credible enough to guide footprint decisions)
- Stockout prevention through forward-looking demand forecasts that flag risk before stock runs out
- Reduced overstock and holding costs via AI-suggested reorder optimization that avoids over-buying
- Faster exception response with alerts prioritized by financial impact, reducing revenue at risk from undetected issues
- Higher team efficiency — reorder approvals and alert triage handled in one governed workflow instead of email chains and spreadsheets
Technology stack
- OneLake — unified storage and landing zone
- Microsoft Fabric Warehouse — analytics layer for modeling and performance
- Power BI — control tower dashboards, forecasting views, reorder recommendations, and alerts
Want a daily “operations control tower” for your business?
We implement near real-time, exception-first dashboards that sync daily execution with leadership strategy and governed KPIs.
Frequently Asked Questions
What does “near real-time” mean for retail operations reporting?
It means the reporting refresh cadence matches operational decision-making—often multiple times per day—so teams can act on today’s issues (stock risk, POS anomalies, delivery delays) rather than discovering them after they’ve already hurt performance.
Why combine profitability, inventory, POS, and delivery in one reporting layer?
Because operations are connected. Inventory decisions affect POS performance, which impacts delivery load, which impacts cost and profitability. A unified view prevents siloed optimization and reduces time wasted reconciling mismatched numbers across teams.
What’s the biggest mistake teams make when building operations dashboards?
They start with visuals instead of KPI governance. If definitions aren’t locked and validated (e.g., profitability logic, inventory state rules, delivery status mapping), dashboards look polished but don’t earn trust—so adoption fails.