Healthcare analytics fails when it’s limited to one dataset. Claims alone is too late. Engagement alone is too shallow. Clinical outcomes alone is too slow. We built a unified analytics platform for a musculoskeletal care organization that connects patient journey signals, engagement behavior, surveys, claims/financials, and outcomes—so leaders can identify risk earlier, improve program effectiveness, and make measurable improvements across both clinical and business KPIs.
At a glance:
- Industry: Healthcare / Digital health (Musculoskeletal care)
- Core problem: Data existed across systems, but there was no unified view of journey → engagement → outcomes → financial impact
- What we delivered: A governed analytics platform with risk insights, cohort tracking, and decision dashboards for operations and clinical leadership
- Primary impact: Better risk stratification, improved engagement visibility, and clearer linkage between interventions, outcomes, and cost
- Core stack: OneLake (data layer), Fabric Warehouse (analytics), Power BI (dashboards), Python (feature engineering + risk modeling)
The challenge: outcomes were tracked, but not explainable
The organization had multiple systems generating valuable signals: onboarding and care journey events, engagement behaviors, surveys, clinician interactions, and downstream claims/financial data. But these sources lived in silos. Leaders couldn’t consistently answer questions like:
- Which cohorts are at highest risk of dropout or poor outcomes?
- Which interventions actually move outcomes for which segments?
- How does engagement (or lack of it) translate into cost and claims impact?
Without a unified analytics layer, decisions were slow, attribution was unclear, and optimization became guesswork.
What we set out to solve:
- Create a single source of truth across journey, engagement, surveys, outcomes, and claims
- Define a consistent KPI layer (clinical + operational + financial)
- Build cohort and funnel views for patient journey stages
- Enable risk stratification (dropout risk, outcome risk, cost risk)
- Provide actionable dashboards for clinicians, ops, and leadership
“Healthcare teams don’t need more dashboards. They need a system that explains why outcomes change—and what to do next.”
What “good” looked like (success criteria)
We aligned success criteria around three outcomes: (1) integrated and trustworthy data, (2) explainable performance across cohorts, and (3) operational workflows that can act on risk—not just observe it.
Success criteria:
- Integration: Journey + engagement + survey + outcomes + claims in one model
- Trust: Governed KPI definitions and reconciled metrics
- Actionability: Clear risk flags, exception views, and intervention tracking
- Cohorts: Segment analysis by condition, severity, channel, geography, and demographics (where applicable)
- Measurability: Link interventions → engagement lift → outcomes → financial impact
Solution overview
We built a healthcare analytics foundation that standardizes all key datasets into OneLake, models them into a decision-ready warehouse (Fabric Warehouse), and serves clinical + business dashboards in Power BI. On top of the metric layer, we added cohort tracking and risk features that help teams prioritize actions—whether it’s improving onboarding, preventing dropout, or optimizing care pathways.
1. Unified data foundation (OneLake)
We consolidated data from multiple systems into OneLake with consistent identifiers and standardized event schemas. This eliminated duplicate interpretations of the same patient journey and enabled reliable end-to-end tracking across stages.d what customers paid.
2. Decision-grade analytics model (Fabric Warehouse)
We built a warehouse model designed for healthcare questions:
- Patient journey funnel (enroll → first engagement → sustained engagement → milestone outcomes)
- Cohorts and segmentation (program type, condition, severity, channel, time cohorts)
- Outcome measures and time-to-outcome tracking
- Claims/financial linkage (where available) for cost and utilization views
This made it possible to analyze outcomes with context—what happened before the outcome, not just the outcome itself.
3. Risk stratification and feature signals (Python)
We engineered risk signals using journey and engagement features—such as early engagement patterns, missed milestones, survey indicators, and change trajectories—so teams can identify:
- Dropout risk (who is likely to disengage)
- Outcome risk (who is unlikely to improve without intervention)
- Cost/claims risk (where downstream financial risk may concentrate)
The goal is not “black-box ML.” It’s operationally useful risk ranking that clinicians and ops teams can trust and act on.
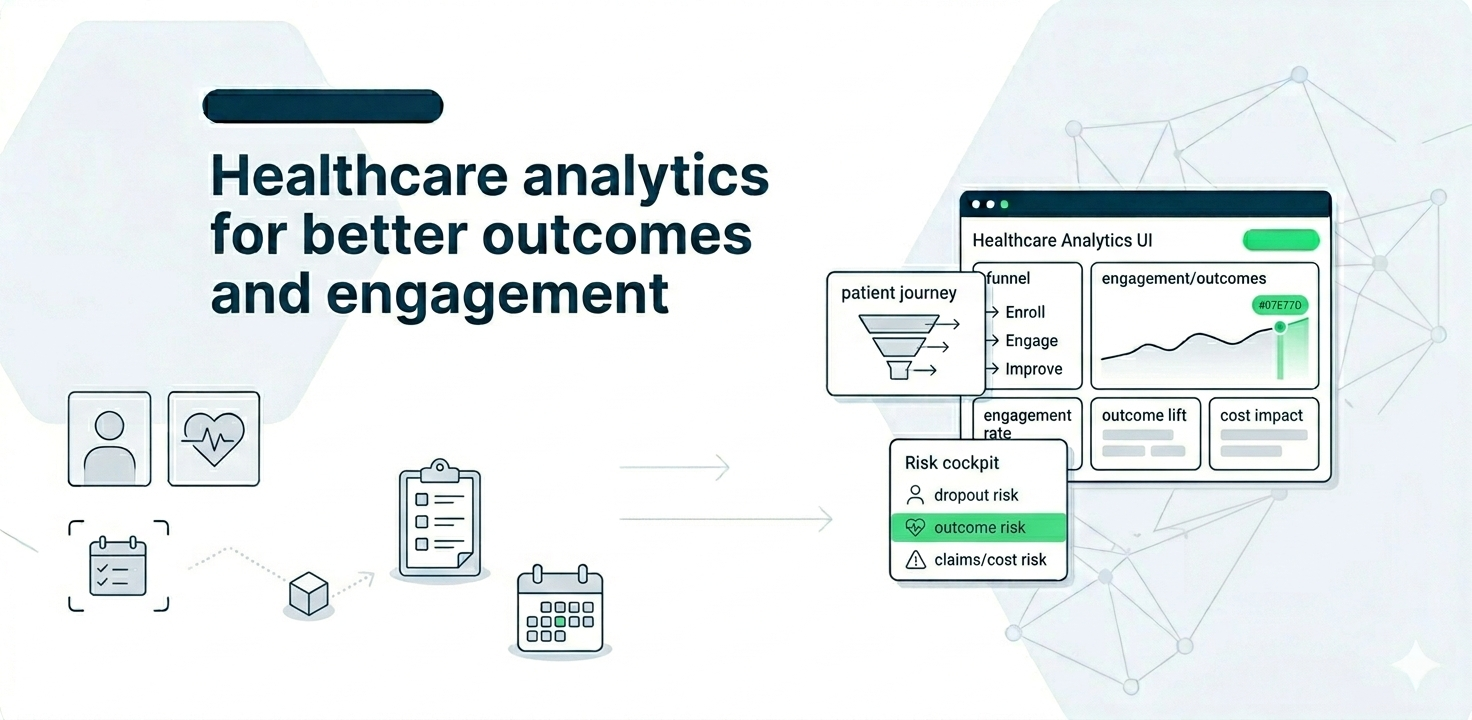
4. Clinical + operations dashboards in Power BI
We delivered dashboards designed around decision workflows:
- Leadership view: program performance, cohort trends, outcome lift, utilization patterns
- Ops view: funnel drop-offs, engagement drivers, SLA adherence, exceptions
- Clinical view: risk queues, patient progress, intervention tracking, follow-up outcomes
This created a common language across clinical, operations, and business teams.
Implementation playbook
Healthcare data projects derail when teams try to “model everything” upfront. We delivered iteratively: lock the KPI layer and identity resolution first, then expand cohorts and journeys, then add risk signals and operational views.
- Phase 1: KPI + identity alignment — define outcomes, engagement, and financial metrics; unify identifiers
- Phase 2: Data foundation — OneLake ingestion + quality checks + event standardization
- Phase 3: Warehouse modeling — Fabric Warehouse model + cohort logic + reconciliations
- Phase 4: Operationalization — dashboards + risk queues + intervention tracking loops
- Phase 5: Ongoing support and enhancements
Impact
- Earlier risk detection using journey + engagement signals (not post-hoc reporting)
- Clearer cohort performance visibility across program types and patient segments
- Improved operational focus via exception-first dashboards and risk queues
- Stronger linkage between interventions, outcomes, and financial impact
- More consistent decision-making through governed KPI definitions across teams
Technology stack
- OneLake — unified healthcare data foundation
- Microsoft Fabric Warehouse — analytics model for journey + claims + outcomes views
- Power BI — clinical/ops/leadership dashboards
- Python — feature engineering and risk stratification signals
Want a unified analytics layer that connects outcomes to action?
We create a decision-grade analytics foundation that connects performance cohorts and clinical interventions directly to financial impact.
Frequently Asked Questions
Why is combining engagement + outcomes + claims important in healthcare analytics?
Because each dataset alone is incomplete. Engagement explains behavior, outcomes show effectiveness, and claims reveal downstream cost. Combining them enables you to understand what changed, why it changed, and what it cost—by cohort and intervention.
What makes “risk stratification” operationally useful (not just a model)?
A risk system is useful when it’s explainable, tied to action, and monitored. The output should be a prioritized queue with clear drivers (missed milestones, low engagement, negative survey shift) and measurable intervention outcomes.
What’s the biggest reason healthcare dashboards fail adoption?
Lack of KPI governance and inconsistent definitions across teams. If “engagement,” “active,” or “successful outcome” changes by dashboard or function, trust collapses—and teams revert to spreadsheets and gut calls.