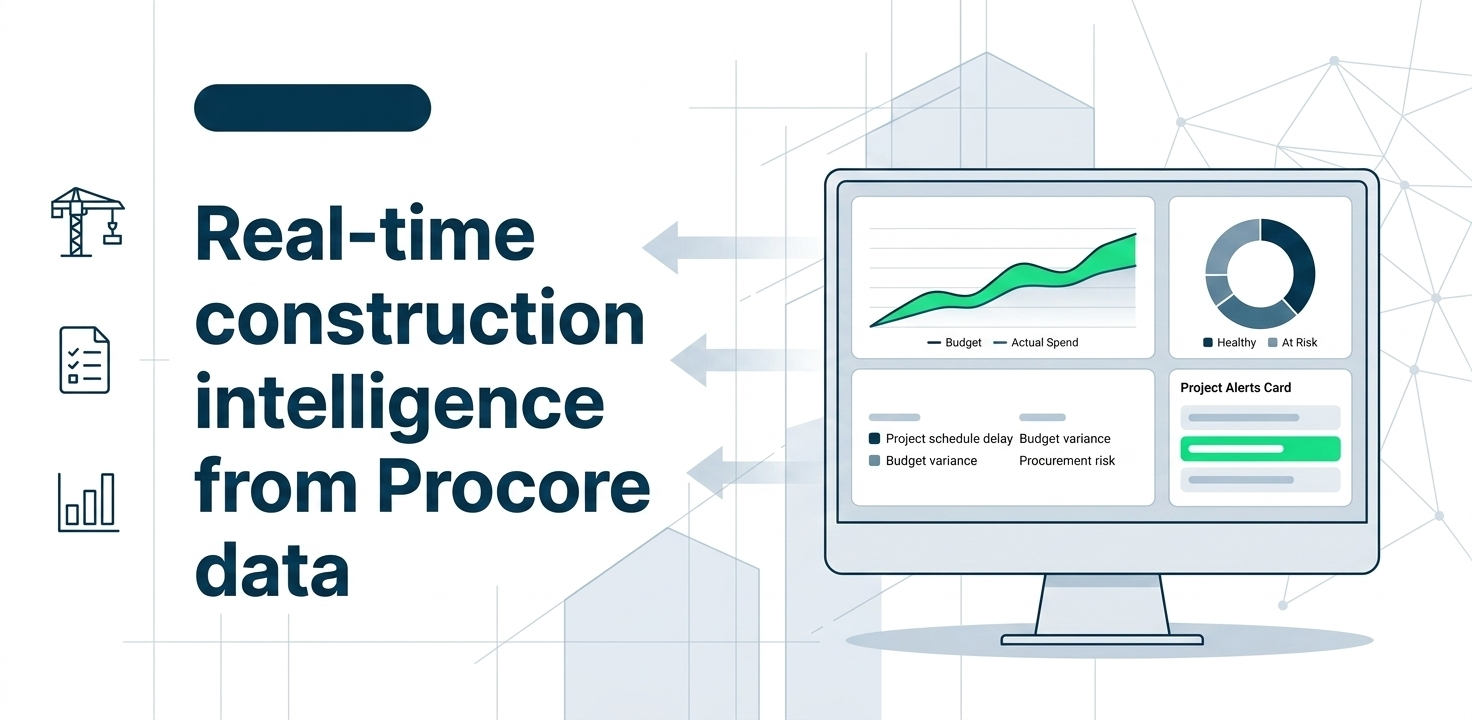
Construction companies operate hundreds of projects simultaneously, each with its own contracts, budgets, schedules, subcontractors, and operational risks. Despite using modern systems such as Procore, many organizations still struggle to translate project data into actionable financial and operational insights.
A mid-sized construction and engineering firm approached DataCult to build a centralized project intelligence platform that would provide leadership with clear answers to questions like:
- Are projects running over or under budget?
- Which projects are likely to miss schedule commitments?
- How accurate are our revenue and cost forecasts?
- Which operational issues (RFIs, submittals, observations) are delaying projects?
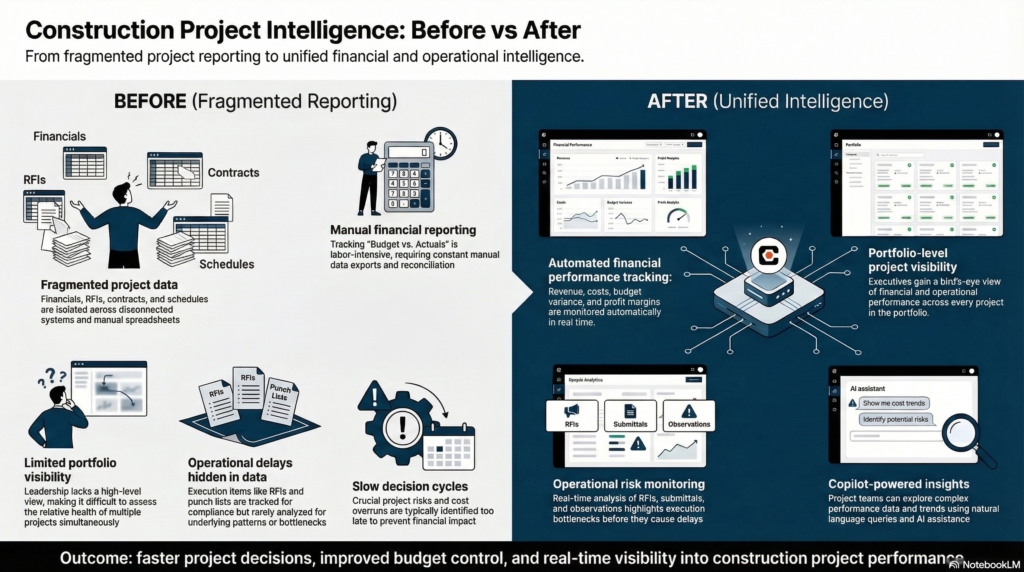
The goal was to move from fragmented reporting and manual financial tracking to an integrated project intelligence layer powered by Procore data, Microsoft Fabric, and Copilot-enabled analytics.
The Solution
DataCult designed and implemented a Project Intelligence Platform that unified financial and operational data into a single analytics environment.
The solution combined Procore operational data, financial metrics, and project management signals into a centralized analytics model using Microsoft Fabric.
Key components included:
Centralized Project Data Foundation
All Procore datasets—including financials, project management events, and operational metrics—were ingested into Microsoft Fabric’s OneLake environment. This created a unified and governed data foundation across all projects.
Financial Intelligence Layer
A comprehensive financial analytics model was developed to monitor project health across multiple dimensions:
- Total Revenue
- Total Costs
- Gross Profit and Profit %
- Budget Variance
- Forecasted Cost to Completion
- Project Over / Under performance
This enabled leadership to understand true project financial performance in real time.
Project Performance Scorecards
To improve operational visibility, the team built project health scorecards that tracked indicators such as:
- Budget status
- Schedule progress
- Contract completion
- Operational risk signals
These scorecards allowed leadership to quickly identify projects requiring intervention.
Operational Insights from Procore
Operational project activities were analyzed to uncover execution bottlenecks. Dedicated analytics views were created for:
- RFIs (Requests for Information)
- Submittals
- Punch Items
- Observations
- Change Events
- Daily Logs
These insights highlighted delays, bottlenecks, and operational risks across projects.
Copilot-Enabled Analytics
To make analytics accessible beyond technical teams, a Copilot layer was integrated to allow natural-language interaction with project data.
Executives and project managers could ask questions such as:
- “Which projects are currently over budget?”
- “Show projects with delayed RFIs.”
- “Which projects have the highest cost variance?”
This dramatically reduced the time required to access critical project insights.
Platform Architecture
The platform was designed to scale with growing project portfolios while ensuring data reliability and governance.
Data Sources
- Procore project management platform
- Financial project data
- Contract and budget datasets
- Operational project activities
Data Engineering Layer
Procore datasets were extracted and transformed using automated data pipelines, preparing them for analytics consumption.
Key engineering capabilities included:
- Data pipeline orchestration
- Historical data integration
- Data transformation and validation
- KPI model creation
Unified Data Platform
All project datasets were centralized in Microsoft Fabric OneLake, enabling:
- unified storage
- standardized data models
- high-performance analytics
Analytics & Reporting
Power BI dashboards were developed for different organizational stakeholders:
- Executive leadership
- Project managers
- Finance teams
- Operations teams
These dashboards enabled real-time monitoring of project financials and execution health.
Analytics Delivered
The project delivered a comprehensive set of dashboards covering financial performance, project operations, and risk indicators.
Financial Intelligence
WIP Reporting
- Revenue earned
- Costs to date
- Estimated earnings
- Work completed vs billed
Contract Intelligence
- Original contract values
- Approved change orders
- Revised contracts
- Payments received
Budget Variance Monitoring
- Original budgets
- Budget modifications
- Committed costs
- Estimated cost to completion
- Project over/under analysis
Profitability Insights
- Adjusted contract price
- Projected costs
- Gross profit and loss
Operational Project Insights
Project Scorecard
- Overall project health indicators
- Budget, schedule, and cost signals
- Risk indicators for operational delays
RFI Analytics
- Open RFIs
- Late RFIs
- Average days late
- Time to close RFIs
Submittal Analytics
- Total submittals
- Open and late submittals
- Review cycle time
Observation Tracking
- Open observations
- Late observations
- Operational risk indicators
Punch Item Monitoring
- Total punch items
- Delayed closures
- Completion timelines
Daily Log Insights
- Safety indicators
- Accident tracking
- Compliance reporting
- Log completion rates
Business Outcomes
The new analytics platform significantly improved the company’s ability to manage project performance.
Unified Financial Visibility
Leadership gained a single source of truth for project financial performance, enabling faster and more accurate decision-making.
Early Detection of Budget Overruns
Project managers could identify cost overruns and budget risks earlier, allowing corrective actions before financial impact escalated.
Improved Project Execution Monitoring
Operational analytics provided visibility into RFIs, submittals, and other execution bottlenecks, reducing delays across projects.
Faster Reporting Cycles
Automated pipelines and dashboards eliminated manual reporting processes, allowing real-time visibility across all projects.
Data-Driven Project Governance
The organization moved from reactive reporting to proactive project management using analytics and predictive insights.
Impact
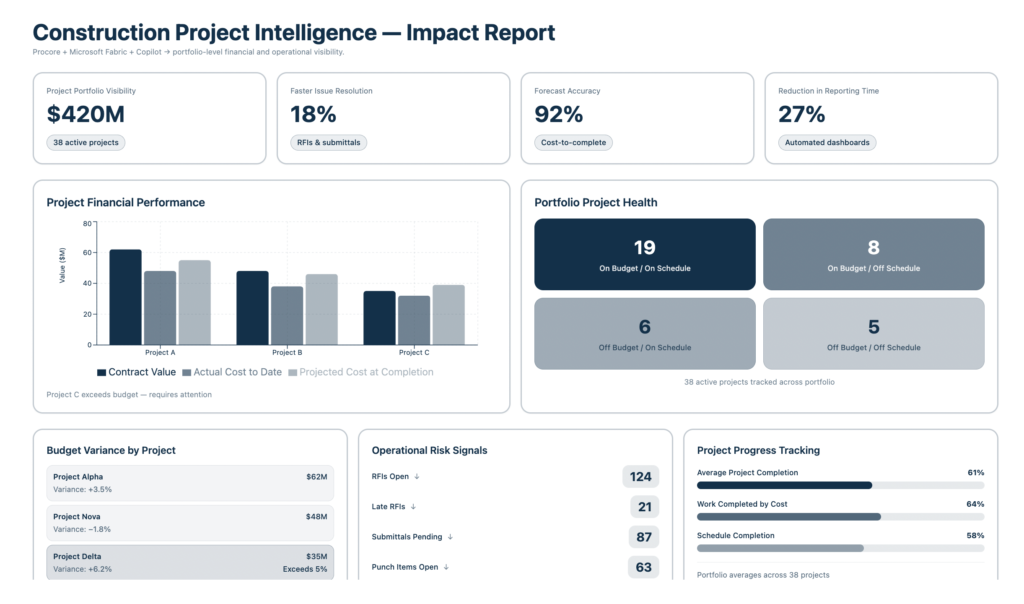
The project transformed how the company monitored and managed project performance.
Key impact areas included:
- Real-time visibility into project financial health
- Early identification of project risks and delays
- Faster access to operational insights from Procore data
- Automated reporting replacing manual spreadsheets
- Executive-level decision support powered by Copilot
The company now operates with a centralized project intelligence platform, enabling leadership to monitor dozens of projects simultaneously while maintaining control over budgets, schedules, and operational risks.
Turn Your Project Data Into Real-Time Construction Intelligence
Transform project data into actionable dashboards that track budgets, contracts, RFIs, and project health across your construction portfolio.
Frequently Asked Questions
How can Procore data be used for advanced construction analytics?
Procore stores large amounts of project data such as budgets, RFIs, schedules, commitments, and change orders. By integrating Procore with a modern data platform like Microsoft Fabric, companies can centralize this data and create analytics dashboards that provide visibility into project financials, operational KPIs, and delivery performance.
What kind of dashboards can be built using Procore data?
Typical dashboards include:
-
Project financial dashboards (Budget vs Actual, committed cost, margin tracking)
-
Operational dashboards (RFIs, submittals, delays, change orders)
-
Portfolio-level dashboards for leadership visibility across projects
-
Contractor performance dashboards
-
Schedule and progress monitoring dashboards
These dashboards help project managers and executives make faster, data-driven decisions.
Why integrate Procore with Microsoft Fabric?
Microsoft Fabric provides a unified data platform where Procore data can be ingested, transformed, and modeled into analytics-ready datasets. This enables:
-
Scalable data pipelines
-
A centralized construction data warehouse
-
Faster reporting through Power BI dashboards
-
AI-assisted analysis using Copilot
What challenges do construction companies face with Procore reporting?
Many construction firms rely on manual exports and spreadsheets to analyze Procore data. Common challenges include:
-
Fragmented reporting across projects
-
Manual data consolidation
-
Lack of real-time project insights
-
Limited visibility into portfolio performance
-
Difficulty tracking financial KPIs across multiple projects
Modern analytics platforms solve these problems by automating data pipelines and enabling real-time dashboards.
What impact can analytics have on construction project management?
When Procore data is transformed into structured analytics dashboards, construction teams can:
-
Track budget vs actual costs in real time
-
Identify delays and risk early
-
Monitor contractor performance
-
Improve project profitability
-
Make faster decisions with centralized insights
This leads to more predictable project delivery and improved financial control.
Can AI or Copilot help analyze construction project data?
Yes. AI assistants such as Copilot can help users ask natural language questions about project data, such as:
-
“Which projects are exceeding budget?”
-
“What are the top delay drivers this quarter?”
-
“Which subcontractors have the most change orders?”
This allows project leaders to explore insights without writing queries or building reports.
What systems can be integrated with Procore for better analytics?
In addition to Procore, construction analytics platforms often integrate with:
-
ERP systems (financials and procurement)
-
Project scheduling tools
-
Cost management systems
-
Document management systems
-
Excel-based planning files
Combining these sources creates a complete view of project performance.
How long does it take to build a Procore analytics platform?
A typical implementation involves:
-
Data ingestion and pipeline setup
-
Data modeling and KPI definition
-
Dashboard and reporting layer
-
Validation with project teams
Depending on scope, most implementations take 6–12 weeks to deliver production-ready dashboards.