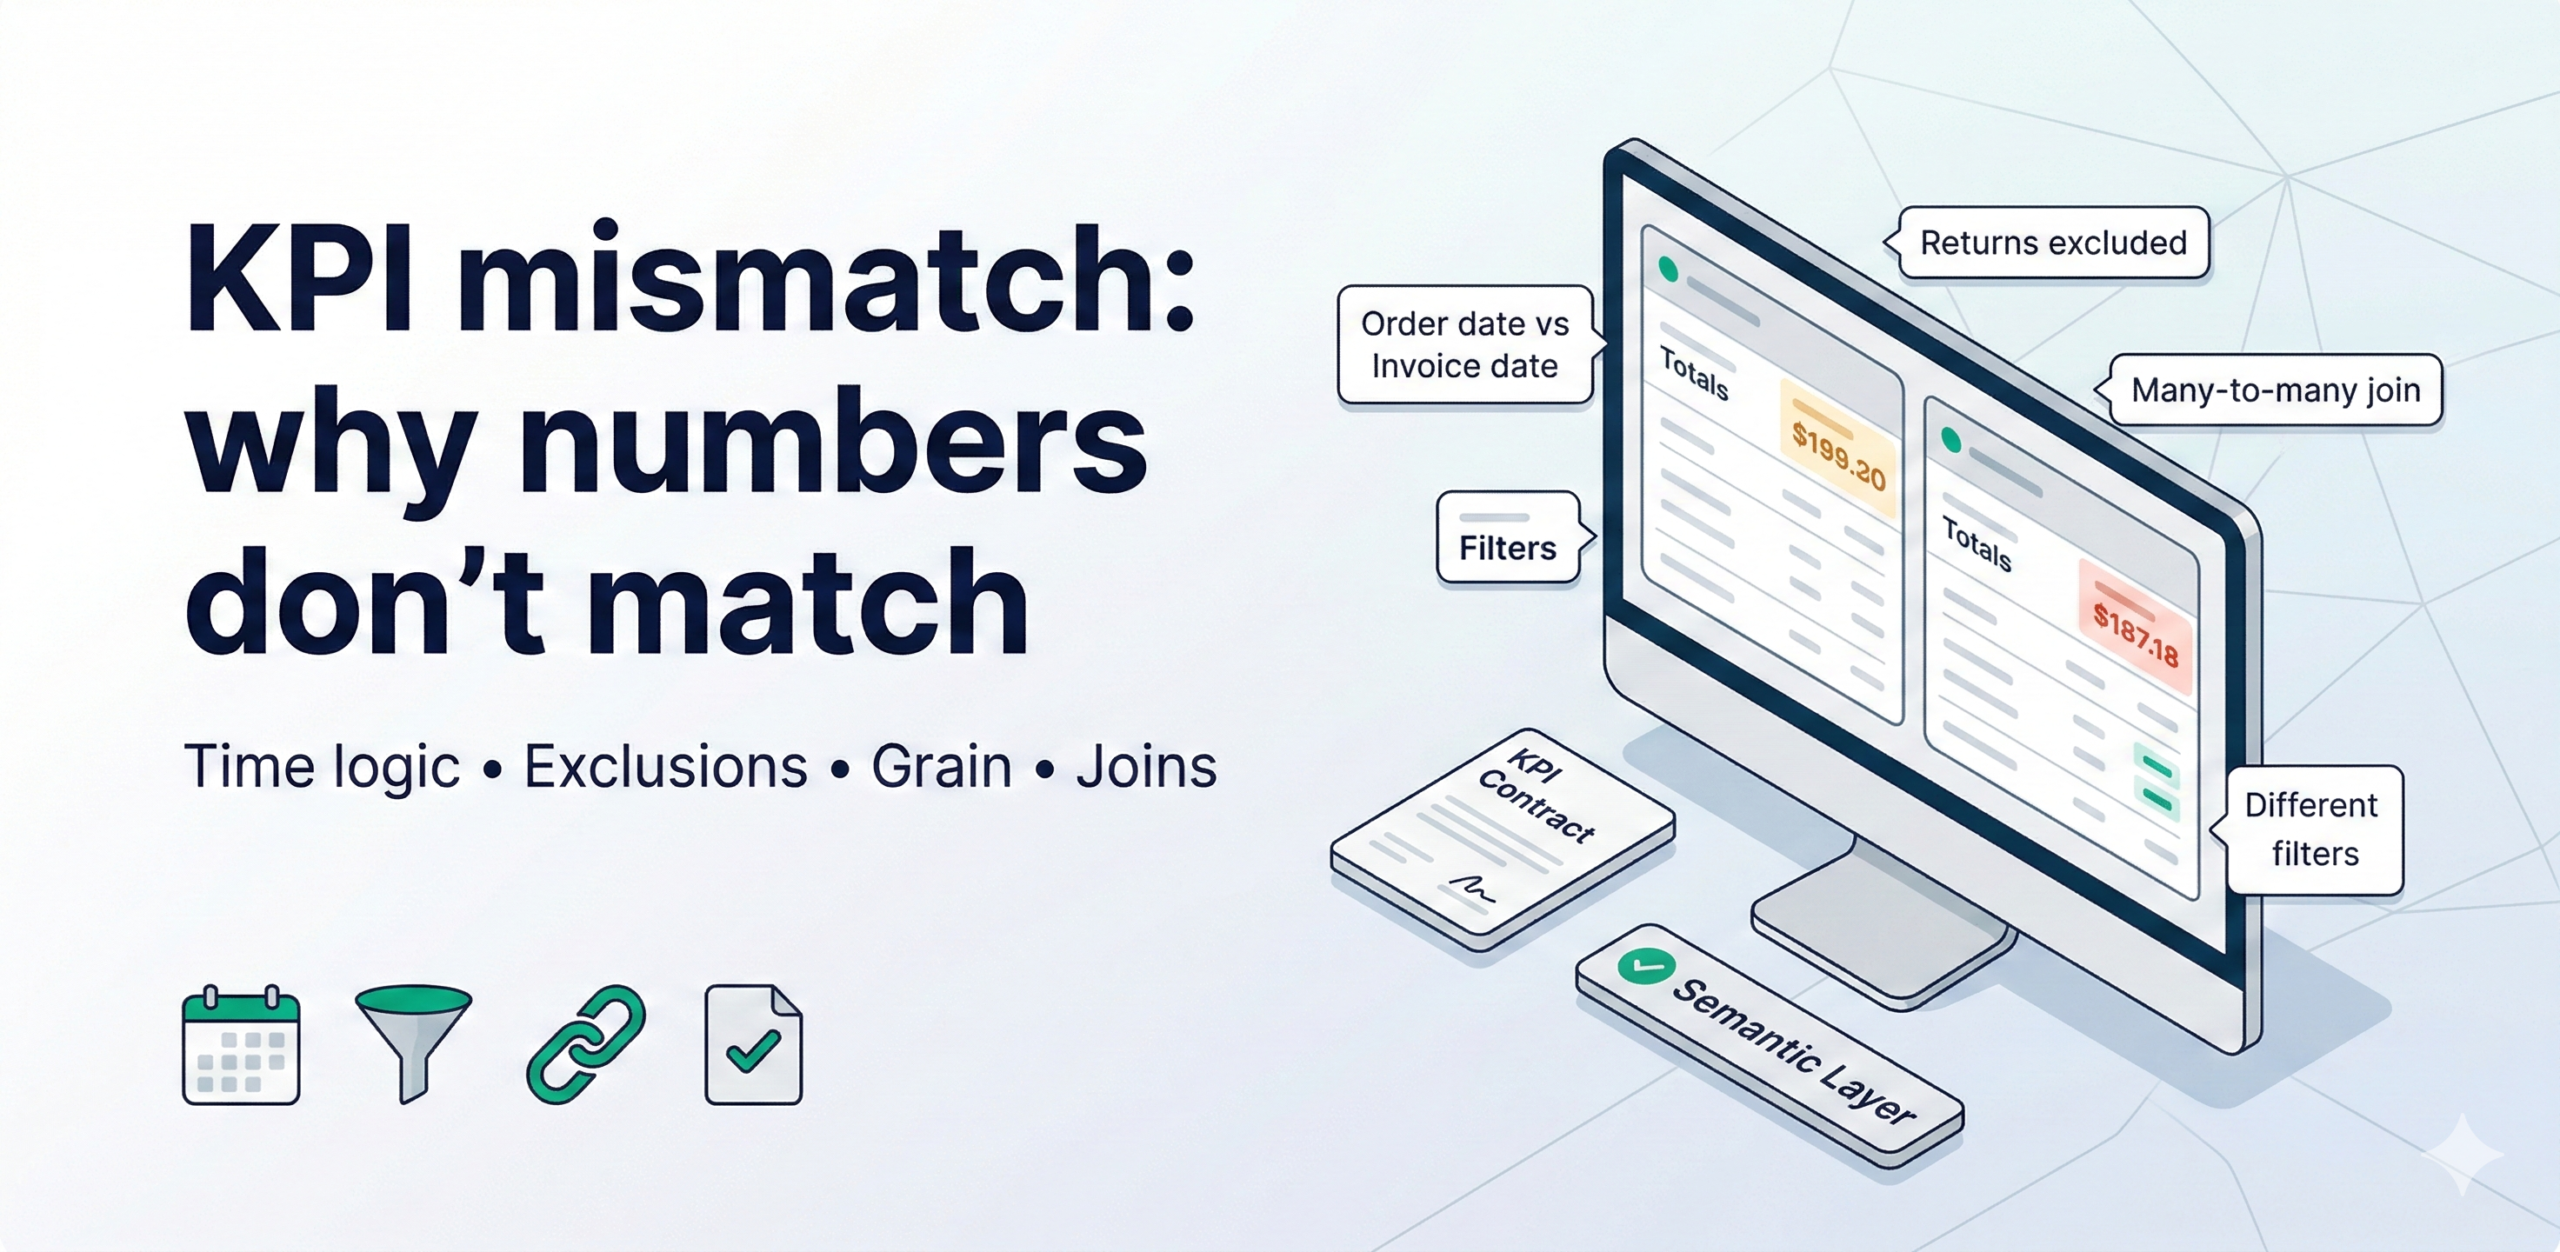
Dashboard numbers don’t match because different teams apply different time logic, exclusions (returns/cancellations), joins, filters, and reporting grain—even when they’re using the same data source. The permanent fix is to implement a KPI Contract + a governed Semantic Layer, backed by automated tests, so every report uses the same definitions and drift is prevented.
What’s actually happening when “numbers don’t match”
When someone says “the dashboard is wrong,” they usually mean one of these:
- Finance says revenue is X, sales says it’s Y
- Ops says inventory is healthy, warehouses say stockouts are rising
- Project controls says EAC is stable, site teams say costs are drifting
- Two Power BI reports disagree on “active customers”
These aren’t “BI bugs.” They’re definition bugs.
The 7 mismatch types (and how to recognize them fast)
Use this as your diagnostic table. It’s the quickest way to stop endless arguing.
| Mismatch Type | What it looks like | Typical root cause | Permanent fix |
| Time logic | Same KPI differs by month | Order date vs invoice date vs ship date | Lock KPI time definition in KPI contract |
| Exclusions | One report includes returns/cancels | Unclear rules for reversals, freebies, internal orders | Define exclusions explicitly + implement centrally |
| Grain (aggregation) | Totals match, breakdown doesn’t | KPI correct at order level but wrong at SKU/week | Define KPI grain + enforce model design |
| Joins / duplication | Totals inflated | Many-to-many joins, duplicate keys | Fix keys/bridges + add duplicate tests |
| Filters | Regional totals don’t sum | Different region mapping, channel tags | Centralize dimension mapping + standard filters |
| Gross vs net | Margin/revenue varies | Taxes/shipping/discount inclusion differs | Define gross/net treatment + reconciliation |
| Currency/rounding | Small gaps everywhere | FX conversion timing, rounding per step | Standard FX source + rounding rule |
If you classify the mismatch first, you can fix it once—rather than reconciling forever.
The KPI Contract (copy-paste template)
A KPI Contract is a one-page spec that becomes the source of truth for each KPI. Without it, KPIs become interpretation.
KPI Contract Template (use for your top 10–15 KPIs)
Use this format exactly (in Notion/Sheets/CMS).
KPI Name:
- Business Purpose (decision it supports):
- Owner (approver):
- Consumers (who uses it): Exec / Finance / Ops / Sales / etc.
Definition (1 sentence):
Formula:
- Numerator
- Denominator (if any):
Grain (lowest valid level):
(e.g., Order-line / Invoice-line / Customer-day / Project-week / SKU-store-day)
Time logic:
- Date field used: order_date / invoice_date / ship_date / posted_date
- Time zone/cutoff: (e.g., IST, close at 11:59pm)
- Backdating rules: (yes/no, how)
Inclusions/Exclusions:
- Include:
- Exclude: returns, cancellations, internal orders, test orders, free replacements, etc.
Dimension rules:
- Channel mapping logic:
- Region mapping logic:
- Product hierarchy source of truth:
Currency / rounding:
- Currency source: FX table
- FX date: transaction date / month-end
- Rounding: at row level or after aggregation
Reconciliation / Validation tests (must pass):
- Test 1:
- Test 2:
- Tolerance (if any): ±X%
Change control:
- What triggers change request:
- Approval workflow:
- Versioning: v1.0, v1.1
- Effective date:
If you build KPI contracts for the gold KPIs and enforce them through a semantic layer, metric disputes drop dramatically.
The semantic layer rule (the only rule that matters)
If a KPI is used by leadership, it must be defined once and reused everywhere.
That means:
- No re-writing KPI logic per dashboard
- No “my version of revenue”
- No hidden filters inside report pages
- KPI changes go through approval + release notes
This is how you stop KPI mismatch from returning 3 months later.
Minimum viable “Permanent Fix” (4–6 week MVP)
You don’t need to rebuild your data platform. You need to stabilize your metrics system.
MVP Scope (what you build)
Inputs
- 1–3 core sources (ERP + CRM + ops system, depending on domain)
- Top 10–15 leadership KPIs (gold KPI set)
- Core dimensions: customer, product, location, time, channel
Outputs
- A governed semantic layer for the gold KPIs
- A reconciliation dashboard (validation layer)
- An exception-first “data integrity” view (freshness and completeness)
- A release/change workflow for KPI updates
Timeline (week-by-week)
Week 1: Diagnose + contract
- Collect 10–15 disputed KPIs
- Classify mismatch types (table above)
- Write KPI contracts (first draft) and align owners
Week 2: Model foundations
- Fix keys and dimensions (product/customer/location)
- Define grains + time logic standards
- Implement base fact tables and dimensional mappings
Week 3: Semantic layer build
- Implement gold KPI measures centrally
- Apply consistent filters/exclusions
- Create a KPI dictionary page (definitions + owner)
Week 4: Validation + tests
- Add reconciliation tests (below)
- Build “recon dashboard” showing pass/fail and tolerances
- Fix join duplication and edge cases
Week 5–6 (optional): Rollout + governance
- Refactor existing dashboards to use governed measures
- Add change control + versioning
- Run two cadence cycles and tune
The test pack (engineering meat you should implement)
Metric trust doesn’t come from meetings. It comes from tests that run every day.
A) Data model tests (stop silent inflation)
- No duplicate keys in dimensions (customer_id, product_id, cost_code_id)
- Referential integrity: every fact record maps to valid dimension keys
- Many-to-many detection for joins that cause inflation
- Null rate thresholds for critical fields
B) KPI reconciliation tests (stop disputes)
For each gold KPI, define 1–2 recon tests:
- Finance close alignment:
Revenue (semantic layer) ≈ revenue in finance close report (± tolerance) - Row-level sum check:
Sum(order_line_amount) after exclusions = KPI numerator - Returns/cancellations rule check:
Returns are subtracted consistently and not double counted - Time logic check:
KPI for a given month uses the defined date field only
C) Freshness + completeness tests (stop “stale dashboard” distrust)
- Freshness SLA: dataset updated by X (e.g., 7 AM daily)
- Completeness: expected record count within ±Y%
- Anomaly: KPI swing beyond expected band triggers a flag
These tests convert “trust” from a subjective debate into an operational system.
Typical outcomes (what improves when you do this right)
These are common operational results (not guarantees), but they’re measurable:
- KPI disputes drop because definitions are centralized and documented
- Manual reconciliation reduces because tests replace repeated meetings
- Dashboard adoption increases because users stop second-guessing
- Reporting speed improves because refactoring becomes reuse, not rebuild
Track:
- of KPI disputes per month (proxy: meeting time spent on definition debates)
- % of leadership KPIs governed in semantic layer
- Freshness SLA compliance %
- Weekly active dashboard users (WAU)
Common mistakes (and how to avoid them)
- Fixing each dashboard separately → creates new mismatches later
- Fix: implement gold KPIs centrally, reuse everywhere.
- Not defining grain → breakdowns don’t reconcile
- Fix: KPI contract must include grain.
- Skipping join/key quality → silent inflation
- Fix: dimension key tests + many-to-many detection.
- No change control → drift returns
- Fix: approvals + versioning + release notes.
- No validation layer → trust never returns fully
- Fix: recon dashboard + daily tests.