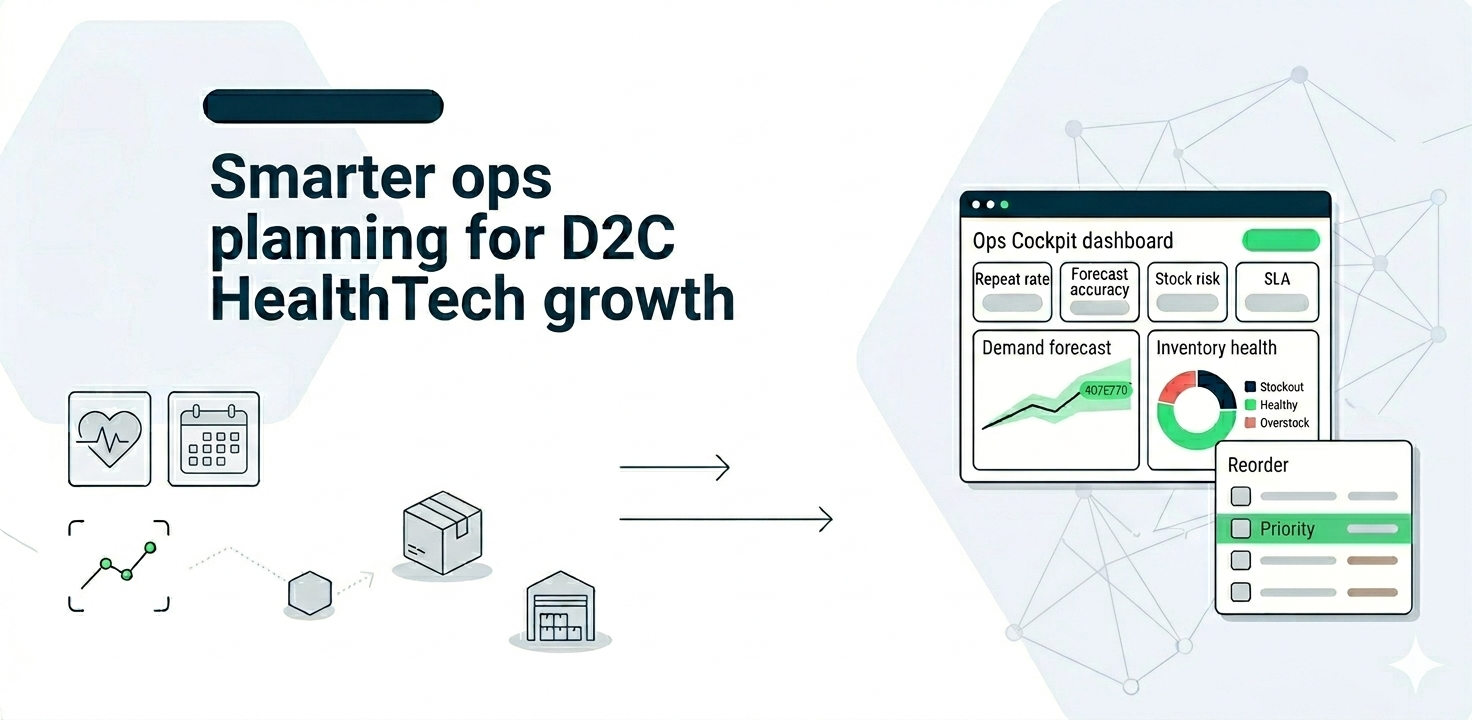
In D2C HealthTech, operational mistakes show up as churn and cash burn: stockouts break trust, overstock locks capital, and fulfillment capacity issues degrade experience. We built an operations intelligence system that connected customer retention signals with demand forecasting, inventory planning, and warehouse capacity modeling—and added AI layers for churn prediction, forecast automation, and replenishment optimization so the brand could scale predictably.
At-a-glance
- Industry: D2C HealthTech / E-commerce
- Core problem: Churn risk, demand variability, inventory imbalance, and capacity constraints were managed reactively
- What we delivered: Unified ops analytics + churn intelligence + forecasting + inventory and capacity optimization with AI
- Primary impact: Better retention visibility, fewer stock surprises, improved planning cadence, and more predictable ops scale
- Core stack: OneLake (data layer), Fabric Lakehouse/Warehouse (analytics), Python (ML + optimization), Power BI (dashboards), Copilot (guided exploration), automated alerts/queues
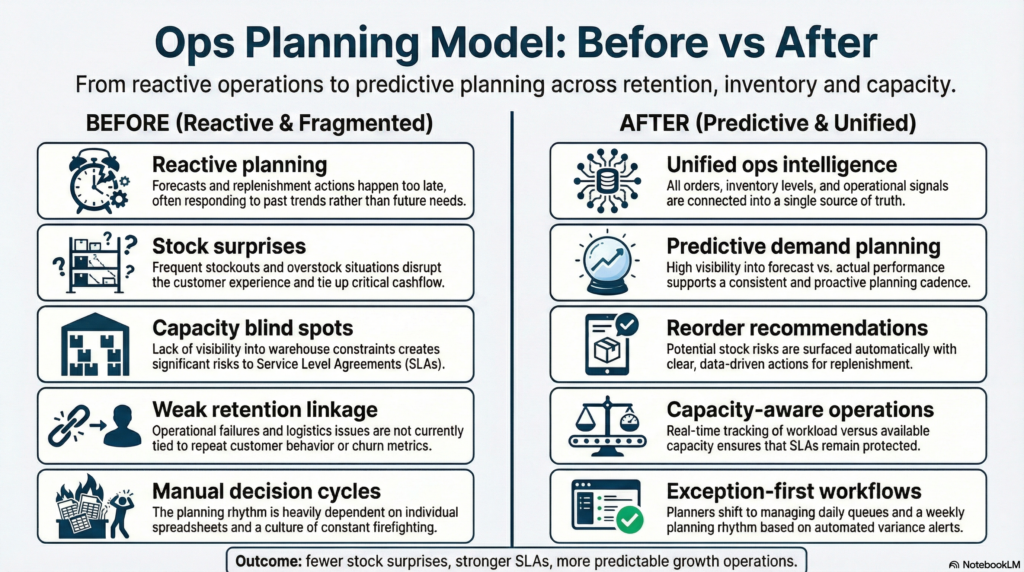
The challenge: growth exposed weak planning systems
As order volume grew, planning became harder: demand was volatile across SKUs and cohorts, warehouse capacity didn’t scale linearly, and customer experience issues (late deliveries, substitutions, stockouts) directly affected repeat rates. The brand needed a system that doesn’t just report what happened—but predicts what will happen and recommends what to do next.
What we set out to solve:
- Build retention visibility: cohort performance, repeat behavior, churn drivers
- Forecast demand at the right granularity (SKU × region × channel × time)
- Translate forecasts into inventory replenishment recommendations
- Model warehouse constraints: picking/packing capacity, cutoffs, staffing, and SLA impact
- Add AI layers: churn prediction, anomaly detection, forecasting automation, and optimization
- Create an operating cadence: weekly/monthly planning with daily exception handling
“Ops becomes a growth lever when planning is predictive—not reactive.”
What “good” looked like (success criteria)
We aligned success to outcomes that founders and ops leaders can measure: fewer stockouts, healthier inventory turns, improved repeat rate, and stable capacity decisions.
Success criteria:
- Retention clarity: cohort repeat and churn drivers visible and explainable
- Forecast accuracy: measurable improvement with bias monitoring (over/under forecast)
- Inventory discipline: reorder recommendations tied to lead times and service levels
- Capacity control: SLA-aware capacity modeling and staffing/shift planning inputs
- Actionability: daily exceptions + weekly planning rhythm
- Scalability: architecture supports new SKUs, regions, and fulfillment nodes
Solution overview
We implemented an integrated ops intelligence platform: customer and commerce data lands into OneLake, is curated into a lakehouse/warehouse model, and served through Power BI dashboards. We layered in AI to predict churn, forecast demand, detect anomalies, and recommend replenishment and capacity actions—so teams operate with a “plan + exceptions” model rather than constant firefighting.
Gallery
1. Unified ops data foundation (OneLake)
We unified key datasets:
- Orders, subscriptions (if applicable), returns, refunds, and customer events
- SKU master, BOM/variants (where relevant), lead times, supplier constraints
- Inventory snapshots, inbound POs, stock movements, fulfillment events
- Warehouse operations signals (pick/pack times, backlog, staffing/throughput proxies)
- Customer experience signals (delivery delays, support tickets, NPS/feedback where available)
Core complexity handled: identity stitching (customer/cohort), SKU standardization, and event sequencing across the order lifecycle.
2. Decision-grade planning model (Lakehouse/Warehouse)
We modeled the business into planning-ready tables:
- Cohort retention and repeat behavior
- Demand at multiple grains (SKU × region × channel × week/day)
- Inventory health (days of cover, projected stockouts, slow movers)
- Service level and SLA drivers
- Capacity signals (throughput, backlog, cutoffs, staffing sensitivity)
This enabled consistent planning without reinventing logic each cycle.
3. AI layers: churn prediction + demand forecasting + anomaly detection (Python)
We added practical AI capabilities:
- Churn/retention risk scoring: predict likelihood of churn by cohort and identify drivers (experience issues, product fit proxies, reorder friction)
- Demand forecasting: time-series and feature-based forecasting with seasonality, promos, and channel mix effects
- Forecast bias monitoring: over/under forecast diagnostics to improve trust and iteration
- Anomaly detection: sudden demand spikes, fulfillment delays, inventory mismatches, and region-level SLA drift
- LLM layer (optional): summarize operational exceptions and generate daily/weekly “ops narrative” grounded in governed metrics
4. Optimization: reorder recommendations + capacity-aware planning
We translated predictions into operational decisions:
- Reorder recommendations: safety stock, reorder point, and order quantities based on lead times and service level targets
- Inventory rebalancing: move stock across nodes (where applicable) to reduce stockout risk
- Capacity planning: simulate workload vs staffing/shift plans and forecast backlog/SLA risk
- Scenario planning: “What if demand increases 20%?”, “What if supplier lead time slips?”, “What if we add a new region?”
This is where the system becomes an operating tool—not just reporting.
Implementation playbook (how we delivered without chaos)
We delivered in phases to protect operations: visibility first, prediction second, optimization third, then automation and adoption loops.
- Phase 1: Visibility + KPI governance — retention, demand, inventory, SLA definitions
- Phase 2: Data foundation — OneLake ingestion, quality checks, curated tables
- Phase 3: Forecasting + churn models — baseline models, validation, bias monitoring
- Phase 4: Optimization layer — reorder recommendations + capacity scenarios
- Phase 5: Operational rollout — dashboards, alerts/queues, planning cadence and playbooks
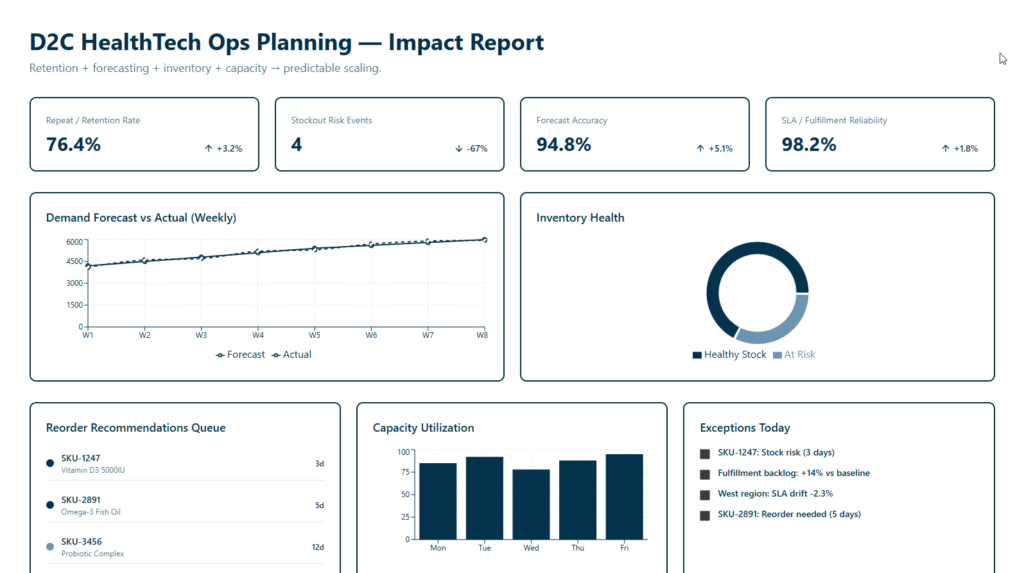
Impact
- Stronger retention clarity through cohort and churn driver visibility
- More predictable inventory with forecast-driven replenishment recommendations
- Reduced operational surprises via anomaly detection and exception workflows
- Better capacity decisions through SLA-aware workload and staffing scenarios
- Faster planning cycles with automated forecasting and standardized models
Technology stack
- OneLake — unified data foundation
- Fabric Lakehouse / Fabric Warehouse — analytics model for planning and BI
- Python — churn prediction, forecasting, anomaly detection, optimization logic
- Power BI — ops dashboards and planning cockpits
- Copilot (optional) — guided exploration and automated operational narratives
Want predictive operations planning that scales with growth?
We build an integrated ops intelligence layer to move you from reactive firefighting to predictable, optimized growth.
Frequently Asked Questions
How do retention and inventory planning connect in D2C?
Experience drives repeat. Stockouts, substitutions, and late deliveries damage trust and directly reduce repeat rates. When forecasting and inventory planning are aligned to cohort behavior and service levels, retention becomes more predictable.
What makes forecasting “production-grade” instead of a one-time analysis?
Production-grade forecasting includes automated pipelines, bias monitoring, explainable drivers (promo/seasonality/mix), and a feedback loop where planning outcomes improve the next forecast cycle.
Where does AI add the most value in ops optimization?
In early warning + prioritization (churn risk, anomaly detection) and in decision automation (forecast-driven replenishment, capacity scenarios). AI is most valuable when it’s tied to actions and tracked against outcomes.