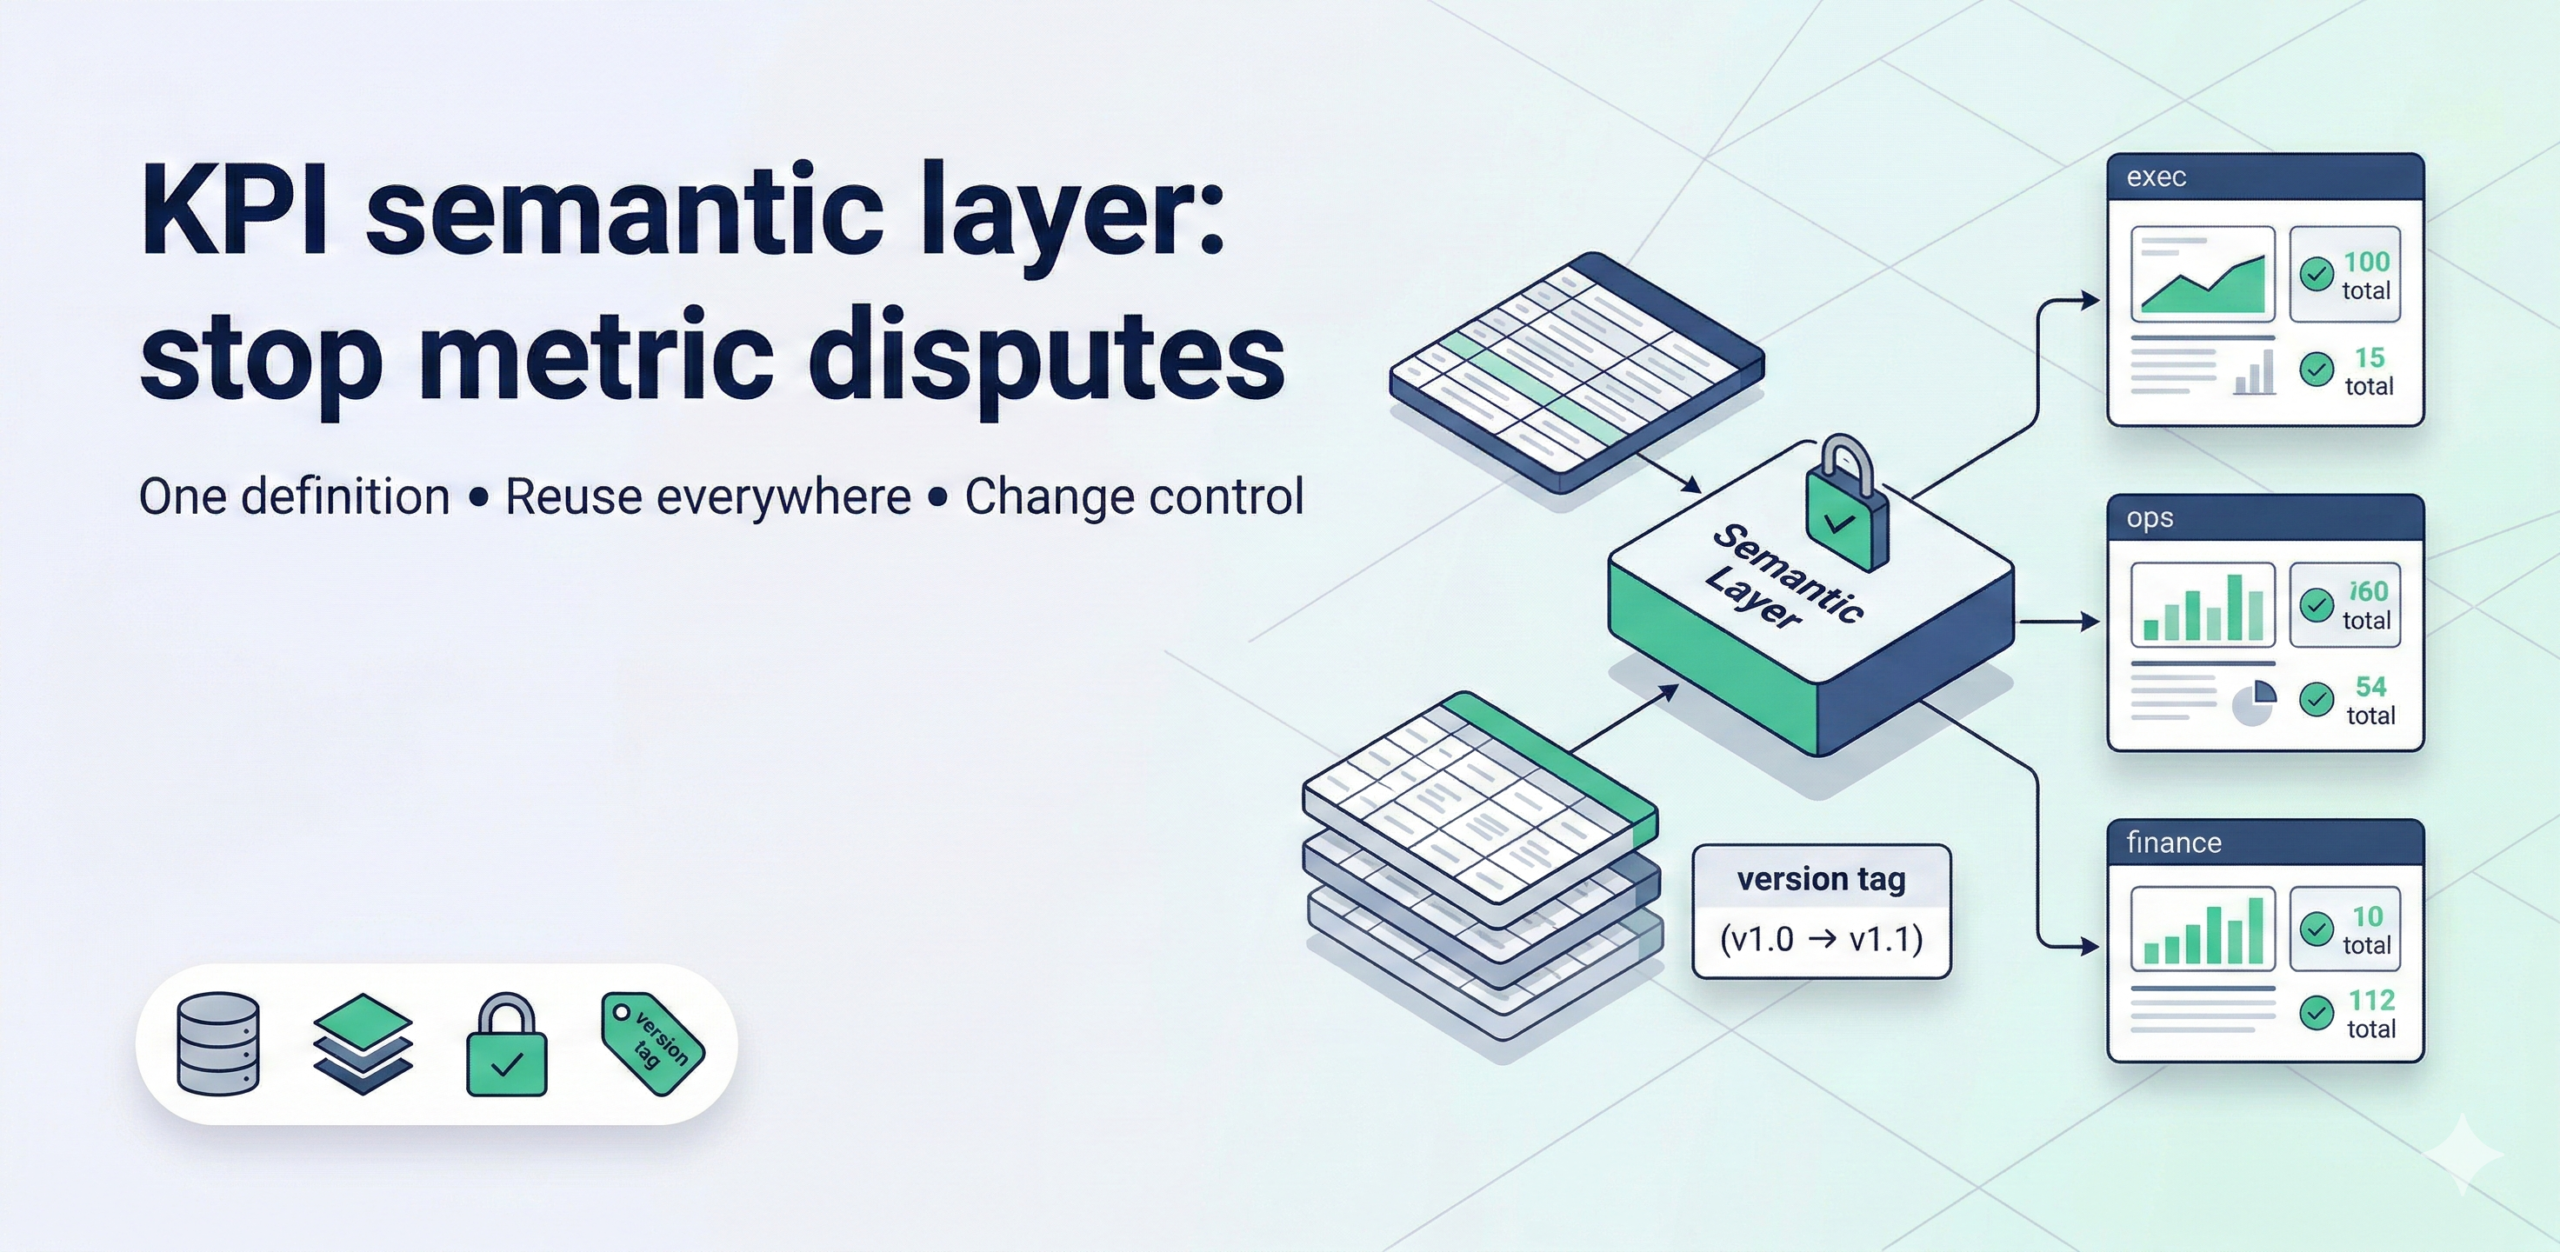
A KPI semantic layer is a governed metrics layer where KPIs are defined once (grain, filters, exclusions, time logic) and reused across all dashboards and tools. It prevents metric disputes by eliminating per-report calculations and enforcing a single “KPI contract” with change control and regression tests.
Why semantic layers matter (the business reason)
If KPI logic lives inside dashboards, your org will inevitably create:
- Multiple versions of the truth — When each dashboard team writes its own revenue, margin, or churn calculation, small differences in filter logic, date attribution, or exclusion rules produce different numbers from identical source data. Finance says revenue is $4.1M; Sales says $4.4M. Both are technically defensible, but neither is the agreed, governed figure. Leadership spends the first 20 minutes of every review meeting reconciling the discrepancy instead of making decisions.
- Rework every time a new dashboard is built — Without a central metrics layer, every new dashboard requires the analyst to re-implement the same KPI logic from scratch: re-derive the date logic, re-apply the exclusions, re-join the dimensions. This is not just inefficient—it is a reliability risk, because each re-implementation introduces a new opportunity for a subtle calculation error. A semantic layer reduces a new dashboard build to connecting pre-validated measures, not re-engineering them.
- Silent drift when someone edits a measure — In a dashboard-embedded logic model, a well-intentioned analyst editing one dashboard’s revenue formula does not update the formula in any other dashboard. The change propagates to users of that dashboard only, and the divergence is invisible until someone compares two reports side by side. A semantic layer makes this class of error structurally impossible: changing the definition in one place changes it everywhere simultaneously, and the change is version-controlled and regression-tested.
A semantic layer turns KPIs into reusable products, not one-off reports.
What a semantic layer is (and isn’t)
The term “semantic layer” is frequently misunderstood. Teams often conflate it with a new data warehouse, a documentation exercise, or a bureaucratic approval process. The table below clarifies exactly what each component is—and what it is not—so that the scope of the project is clear before work begins.
| Item | It is | It isn’t |
| Semantic layer | Central KPI logic + governed measures + standard dimensions | A new warehouse |
| KPI contract | Definition, grain, time logic, exclusions, owner | “A note in a dashboard” |
| Metric catalog | Documentation and discovery | Governance/enforcement |
| Governance | Approvals, versioning, tests | Bureaucracy |
The minimum viable semantic layer (copy-paste checklist)
Use this as your build checklist for MVP:
A) Data model foundation (must-have)
- Fact tables for the domain (orders/invoices/cost/events) — The fact table is the transactional backbone of the semantic layer: one row per business event at the lowest meaningful grain (one row per order line, one row per invoice, one row per cost posting). It must be sourced from the authoritative system of record, not a downstream report extract. Without a clean, agreed fact table, every KPI calculation is building on an unstable foundation.
- Conformed dimensions: product, customer, location, time, channel — Conformed dimensions are shared lookup tables that are used consistently across all fact tables in the layer. If the product dimension in the sales fact table uses a different product hierarchy than the product dimension in the cost fact table, cross-domain analysis (e.g., gross margin by product) will produce incorrect or ambiguous results. Conforming dimensions is often the most time-consuming part of the foundation work, but it is the step that makes the semantic layer genuinely reusable rather than just a collection of isolated models.
- Stable keys (no duplicate dimension keys) — Every dimension must have a unique, stable primary key that fact tables can reliably join to. Duplicate keys in a dimension table cause join inflation: a single order row joins to two product rows and appears twice in every aggregate, silently doubling revenue, cost, or volume figures. Test for key uniqueness on every pipeline run before any measures are computed on top of these tables.
- Defined grain for each KPI — The grain is the precise declaration of what one row in the underlying dataset represents. “Revenue” computed at order grain (one row per order) will produce a different number than “revenue” computed at order-line grain (one row per line item) if there are multi-line orders. Documenting and enforcing the grain for each KPI prevents the most common class of silent aggregation error and is the single most important item in the KPI contract.
B) KPI measures (must-have)
- Gold KPI definitions in a central metrics layer (dbt Metrics, Cube, LookML, or equivalent) — Each gold KPI must be implemented as a single, named, version-controlled measure in the semantic layer tool, not as repeated SQL inside individual dashboards. When a BI tool, notebook, or API query requests “revenue,” it receives the same governed calculation every time. Centralising this in a tool with a proper abstraction layer (rather than a shared SQL snippet in a wiki) ensures the definition is machine-readable, testable, and enforced at query time.
- Time logic enforced centrally (fiscal vs calendar, timezone, attribution window) — Time logic is the most common source of metric discrepancy between teams. Sales may attribute revenue to the order date; Finance to the invoice date; Operations to the shipment date. The semantic layer must specify which date field drives each KPI’s time window, whether the business uses a fiscal or calendar year, and which timezone is canonical for global operations. Once defined centrally, this logic cannot be overridden at the dashboard level.
- Exclusions and filters documented and applied universally (returns, test orders, internal accounts) — Every business has transactions that should be excluded from reported KPIs: cancelled orders, internal test accounts, returned items already reflected elsewhere, intercompany transfers. These exclusions must be written into the semantic layer measure definition, not applied ad hoc at the dashboard level where they will inevitably be applied inconsistently. Document each exclusion in the KPI contract with the business reason, the owning team, and the date it was agreed.
C) Security (must-have)
- Role definitions (exec, manager, operator) — Before implementing Row-Level Security, the access model must be formally defined: which roles exist, what data each role is permitted to see, and which users belong to which role. Role definitions should be documented in a simple access matrix and signed off by the data owner and IT security, not configured informally by the analyst who built the dashboard. Without a clear role model, RLS implementations are inconsistent and hard to audit.
- RLS rules documented and tested (no leakage) — Row-Level Security rules must be explicitly tested by querying each dataset as a restricted role and confirming that only the permitted rows are returned. Leakage tests are particularly important when RLS is implemented at the BI layer rather than the warehouse layer, where a misconfigured filter or an inadvertent full-table export can expose sensitive data to unauthorised users. Run leakage tests on every deployment that modifies the data model or the security configuration.
D) Governance (must-have)
- KPI owner per KPI — Every gold KPI must have a single named business owner who is accountable for the definition, approves any changes to the calculation logic, and is the escalation point when the KPI produces unexpected results. The owner does not need to be a data engineer—they should typically be the most senior person in the business function that the KPI measures. Without a named owner, definition changes accumulate without review and the “single source of truth” gradually fragments.
- Change request + approvals — Any modification to a gold KPI definition—changing the date field, adding an exclusion, adjusting the grain—must go through a lightweight change request process: a written description of the change, the business justification, the affected dashboards, and sign-off from the KPI owner and the data lead. This process does not need to be heavyweight, but it must be consistent. Undocumented changes are the primary reason semantic layers degrade over time into the same fragmented state they were built to replace.
- Versioning (v1.0, v1.1) + release notes — KPI definitions should be version-controlled in the same system as the underlying code (Git), with a semantic version tag applied to each release. Release notes should document what changed, why, and which dashboards are affected. This gives the team a clear audit trail for answering “why did this metric change last month?” and makes rollbacks possible when a change produces unexpected downstream effects.
- Regression tests on the gold KPI set — After every deployment, an automated test suite must verify that the current computed values of all gold KPIs fall within an acceptable tolerance of their known-good baseline. Regression tests are the quality gate that makes the change process trustworthy: owners can approve changes confidently knowing that any unintended side effects will be caught before they reach production dashboards. Without regression tests, every change to the semantic layer is a gamble.
MVP approach (4–6 weeks)
Week 1: KPI contracts + model plan
- Identify the gold KPIs and owners — Run a scoping session with key stakeholders to agree the 5–10 KPIs that appear in the most important reports and generate the most cross-team disagreement. For each KPI, confirm the business owner who will sign off on the definition and own future change requests. Keep the initial gold set small—it is better to have five perfectly governed KPIs than twenty loosely defined ones.
- Define KPI contracts (grain, time logic, exclusions) — For each gold KPI, document the full contract: the business definition in plain language, the grain of the calculation, the date field that drives the time window, the fiscal or calendar year convention, and any rows that must be excluded. Store the contract in version control (a YAML file or a structured doc in the repo), not in a wiki or a slide deck that will become stale. The contract is the authoritative specification for the implementation that follows in weeks 2–3.
- Confirm dimension mappings (product/customer/region) — Audit the existing dimension tables for the domains covered by the gold KPIs. Document any gaps (missing hierarchies, inconsistent codes, broken mappings between source systems) and agree the canonical version of each dimension that the semantic layer will use. Surface any data quality issues at this stage rather than discovering them mid-build in week 2.
Week 2: Build conformed dimensions + base facts
- Fix duplicates and mapping tables — Resolve the dimension quality issues identified in week 1: deduplicate keys, build mapping tables to reconcile product or customer codes across source systems, and backfill any missing dimension attributes needed for the gold KPI breakdowns. These fixes should be implemented as dbt models or equivalent transformation code, not as one-off patches, so they are repeatable and testable going forward.
- Establish join rules and grain for aggregates — Document and implement the join logic between each fact table and its conformed dimensions: which key to join on, whether the join is many-to-one or requires a bridge table, and what grain the resulting aggregate should be computed at. Test each join for inflation using row-count delta checks before the measures layer is built on top. A join that was correct at one grain may silently inflate or deflate aggregates at a different grain.
Week 3: Implement measures centrally
- Build approved measures (gold KPI pack) — Implement each gold KPI as a named, version-controlled measure in the semantic layer tool, following the contracts defined in week 1 exactly. For each measure, write the corresponding regression test that asserts the computed value matches the known-good baseline within tolerance. Do not proceed to dashboard refactoring until all measures pass their regression tests and have been reviewed against the KPI contract by the business owner.
- Enforce time logic + exclusions centrally — Implement the date field selection, fiscal/calendar convention, timezone handling, and all documented exclusions directly in the measure definitions. Add a test that queries each measure with a known date range and confirms the result matches an independently calculated reference value. This is the step that eliminates the most common class of cross-dashboard metric discrepancy: two reports using the same measure name but different implicit date logic.
Week 4: Refactor 1–2 dashboards to reuse measures
- Replace per-dashboard logic — Select the one or two highest-traffic dashboards that contain the most duplicated KPI logic and refactor them to pull all gold KPIs from the semantic layer measures rather than from embedded calculations. Compare the new measure-driven outputs against the previous embedded-logic outputs for the same time period. Any discrepancy is a signal of either a bug in the new implementation or—more commonly—an undocumented exclusion or date rule that was baked into the old dashboard and was never agreed as the canonical definition.
- Add reconciliation dashboard (pass/fail tests) — Build a simple internal reconciliation view that runs the full regression test suite on demand and displays a pass/fail status for each gold KPI. This dashboard is for the data team, not business stakeholders: it provides immediate visibility into whether the semantic layer is producing correct values after each deployment. Make it the first thing the team checks after any change to the measures layer.
Week 5–6 (optional): Governance + rollout
- Introduce change control and release notes — Formalise the change request process defined in the governance checklist: a PR template for KPI definition changes, a required sign-off from the KPI owner before merge, and a release note template that documents what changed and which dashboards are affected. Communicate the process to all teams who currently build dashboards so that future requests to modify a gold KPI go through the governed channel rather than being made unilaterally inside a report.
- Expand to additional dashboards — Using the reconciliation dashboard as a quality gate, systematically refactor the remaining high-traffic reports to consume measures from the semantic layer. Prioritise dashboards by the frequency with which their KPI outputs are disputed or questioned in review meetings—these are the highest-value targets. Each refactored dashboard eliminates another source of potential divergence and reduces the long-term maintenance burden on the data team.
The test pack (engineering meat)
Data model tests
These tests validate the structural integrity of the data model before any measures are computed on top of it. They should run on every pipeline execution and block deployment if they fail. A passing measure built on a broken model is a false assurance—these tests ensure the foundation is sound.
- No duplicate keys in dimensions (product_id, customer_id, location_id) — Asserts that the primary key column in each dimension table contains only unique, non-null values. A single duplicate key causes every fact row that joins to that dimension to appear multiple times in aggregates, inflating every downstream KPI by an arbitrary factor. This is one of the most impactful tests in the suite and one of the fastest to implement: a simple
count(*) vs count(distinct key)comparison that runs in seconds. - No many-to-many join inflation (detect with row count deltas) — After joining a fact table to a dimension, asserts that the resulting row count equals the original fact table row count. If the join produces more rows than the source fact table, a many-to-many relationship exists where a one-to-many was assumed, and every aggregate computed from the joined result is inflated. Row count delta checks are particularly important for bridge tables and slowly changing dimensions where the cardinality assumptions are less obvious.
- Referential integrity (all facts map to valid dims) — Asserts that every foreign key value in the fact table has a corresponding row in the relevant dimension table. Orphaned fact rows—transactions that reference a product_id, customer_id, or location_id that does not exist in the dimension—are either dropped silently from joins or, in some join configurations, produce NULL dimension attributes. Either outcome corrupts breakdowns by product, customer, or region without triggering any obvious error.
KPI regression tests (gold KPIs)
These tests validate the correctness and stability of the gold KPI measures themselves. They should run on every deployment that touches the measures layer, fact tables, or dimension tables. A failing regression test blocks the deployment and triggers a review—it does not get merged and fixed later.
- KPI totals match source-of-record within tolerance — Computes each gold KPI for a defined reference period and compares the result against a pre-agreed value from the authoritative source system (ERP, CRM, billing platform). The tolerance band (e.g., ±0.5%) accounts for legitimate timing differences between systems. A breach outside the tolerance is a signal of a calculation error, a missing exclusion, or a broken source feed—all of which must be investigated before the deployment proceeds.
- KPI breakdown sums equal KPI total (where expected) — Verifies that the sum of a KPI broken down by a dimension (e.g., revenue by region) equals the KPI’s overall total. This test catches the most common class of semantic layer bug: a filter applied at the aggregate level that is not consistently applied at the breakdown level, causing the parts to not add up to the whole. In reporting contexts, this discrepancy is one of the most trust-destroying things a user can discover.
- Date logic check (only defined date field drives KPI window) — Queries the KPI for a fixed time window using the canonical date field and confirms that the result changes as expected when the window shifts. Also confirms that substituting an alternative date field (e.g., shipment date instead of order date) produces a different result—proving that the measure is genuinely bound to the correct date field and not accidentally pulling all rows regardless of the time filter.
- Exclusion consistency (returns/cancel logic applied everywhere) — For each documented exclusion (cancelled orders, returned items, internal test accounts), verifies that the excluded rows are absent from the KPI total and from every breakdown dimension. Exclusions that are applied at the total level but missed at the breakdown level produce subtotals that do not reconcile to the headline figure—a common source of the “the numbers don’t add up” complaint that erodes stakeholder trust in the semantic layer.