Exception-first dashboards turn reporting into action by surfacing only the KPIs that breach thresholds, prioritizing them by impact, and assigning owners with SLAs and drilldowns. This design drives adoption because it reduces noise and creates a repeatable “work the queue” operating rhythm.
The 5-part exception model (copy-paste)
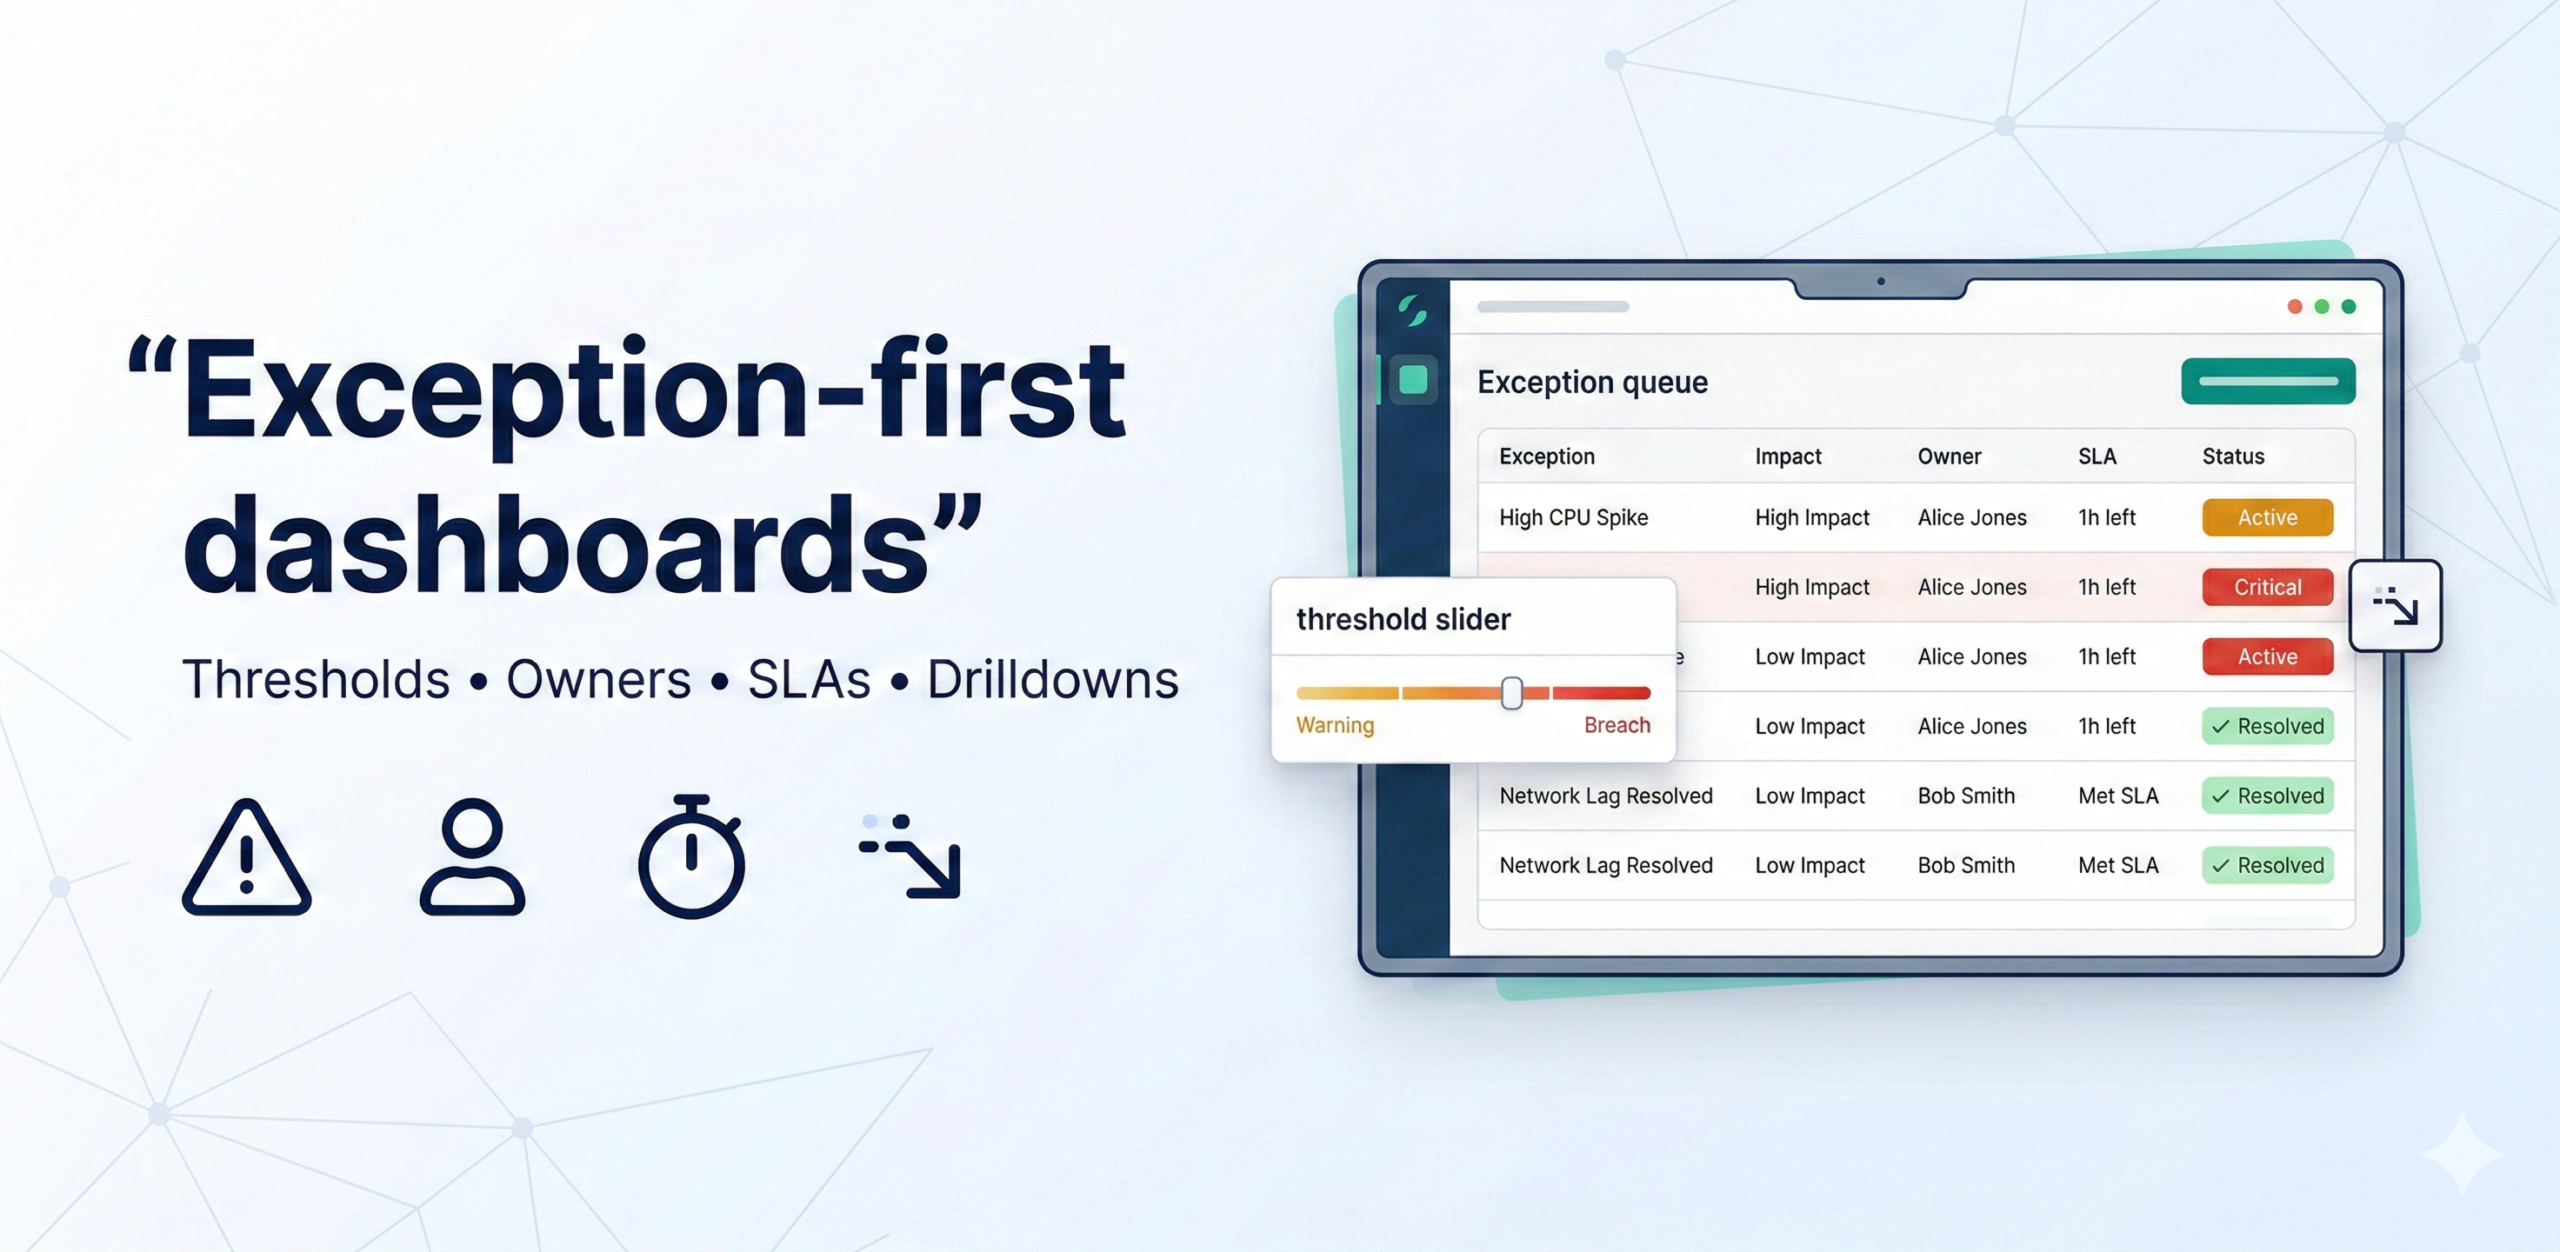
Every exception displayed on the dashboard should carry all five of these attributes. Together they answer the four questions a manager needs to act: What is wrong? How bad is it? Who owns it? When must it be resolved? And where do I look to diagnose it? Missing any one of the five forces the recipient to go hunting for the answer—and they usually don’t.
- Thresholds: warning vs breach — Every KPI needs two threshold levels, not one. A warning is an early signal that a metric is trending toward a problem: it prompts the owner to investigate before the situation escalates. A breach is the point at which the metric has crossed into unacceptable territory and action is mandatory. Using a single threshold produces constant noise (everything triggers) or dangerous silence (nothing triggers until it’s too late). The two-level approach gives the team a “yellow light” to prepare before the “red light” forces a response.
- Priority: impact × urgency — Not all exceptions are equally important, and a list that treats a 0.2% cost variance the same as a 15% stockout sends the wrong signal. Priority should be scored on two dimensions: impact (the financial, operational, or reputational cost if the exception is not resolved) and urgency (how quickly the situation will worsen if left unaddressed). Multiplying the two scores produces a single priority rank that determines the order in which the queue is worked. This prevents high-visibility but low-impact items from crowding out genuinely critical ones.
- Ownership: who fixes it — Every exception must have a single named owner—a person, not a team—who is accountable for resolving it within the SLA. Shared ownership is the same as no ownership: if three people are responsible, each assumes the others are handling it. The owner does not need to fix the problem personally; they need to ensure it gets fixed and report back. Ownership should be assigned at the time thresholds are set, not reactively when an exception fires, so there is never ambiguity in the moment.
- SLA: when it’s due — The SLA defines the maximum acceptable time between an exception being raised and it being resolved or formally escalated. Without a time commitment, exceptions linger: they get acknowledged, deprioritized, and forgotten. SLAs should be calibrated to the severity level—a breach-level stockout risk might carry a 24-hour SLA, while a warning-level cost variance might have 7 days. The dashboard should surface how much SLA time remains, and exceptions approaching or past their deadline should be visually flagged to prompt escalation.
- Drilldown: how to find root cause quickly — An exception without a path to diagnosis is just an alarm. Each exception card should link directly to the supporting detail—the specific SKUs driving a stockout risk, the carrier or route behind delivery delays, the cost centres contributing to a variance. The drilldown should be pre-built and scoped to the exception, not a link to a generic overview dashboard where the user has to re-filter everything from scratch. The goal is to get from “there is a problem” to “I understand what is causing it” in under two minutes.
Threshold setting table (use this)
Use the table below as a template to define and document thresholds for each exception in your dashboard. For each KPI, agree the warning and breach levels with the business owner before building, not after. Pre-agreed thresholds prevent the common failure mode where the team sets thresholds by trial and error after go-live, leading to constant recalibration and stakeholder distrust. The SLA column should reflect how quickly the business can realistically act, not an aspirational target.
| KPI | Warning | Breach | Owner | SLA |
| Stockout risk | >5% SKUs at risk | >10% | Inventory ops | 24h |
| Delivery delays | >3% late | >7% | Logistics | 48h |
| Cost variance | >2% 2 weeks | >4% | Controls | 7 days |
MVP in 4 weeks
This four-week plan builds the exception dashboard iteratively, starting with the most important exceptions and adding the governance layer before full rollout. Each week has a concrete deliverable that can be reviewed with stakeholders, so you get feedback early rather than presenting a finished product that misses the mark.
- Week 1: pick 5–7 exceptions + thresholds + owners — Identify the exceptions that matter most to the business by asking: “Which KPI going wrong would cause a leadership escalation within 48 hours?” For each one, run a short session with the relevant business owner to agree the warning threshold, the breach threshold, and the named accountable person. Document the outputs in a threshold register. Resist the temptation to include more than seven exceptions in v1—a focused list that the team actually works is more valuable than a comprehensive list that nobody acts on.
- Week 2: build exception queue + drilldowns — Build the exception queue view: a ranked list of currently active exceptions, each showing the KPI, the current value vs. threshold, the severity level, the owner, and the time remaining on the SLA. For each exception, build or link the pre-scoped drilldown so that clicking the exception immediately surfaces the supporting detail. Conduct a usability review with two or three potential users to verify that the path from exception to root cause is genuinely fast.
- Week 3: add priority scoring and SLA tracking — Implement the impact × urgency priority scoring so the queue is automatically ranked rather than sorted by recency or alphabetically. Add SLA countdown indicators—how many hours or days remain before the exception must be resolved or escalated—and visual flags for exceptions that have breached their SLA without resolution. Introduce a simple closure workflow so owners can mark exceptions as resolved, with the resolution recorded for the root-cause backlog.
- Week 4: run cadence and tune thresholds — Establish the operating cadence: a daily or twice-weekly “queue review” meeting in which owners report on active exceptions and any that have been resolved or escalated. Run the first two or three cycles and use the experience to tune thresholds—raising any that fire too frequently (alert fatigue) and lowering any that fire too late (missed problems). After the tuning cycle, the dashboard is ready for broader rollout.
Tests & guardrails
Exception-first dashboards introduce a specific set of failure modes that standard data quality tests do not catch. These three guardrails address the most common ways the design breaks down in practice—not from bad data, but from misconfigured logic or operational drift.
- Alert fatigue control: cap exceptions to 5–10 per domain — If the exception queue regularly shows 20, 30, or 50 active items, users stop engaging with it. The queue becomes background noise—something to be scrolled past, not worked. Enforce a hard cap of 5–10 exceptions per business domain. If more exceptions are firing than the cap allows, it is a signal to raise thresholds, combine related exceptions, or address a systemic data quality issue rather than simply displaying all of them. A shorter list that drives action is more valuable than a complete list that drives paralysis.
- Priority scoring must be stable (avoid constant reshuffling) — Priority scores should update on a defined schedule—daily or at each queue review—not in real time. If the ranked order of exceptions changes every few minutes, owners cannot form a coherent plan of action and the queue becomes untrustworthy. Stability also means the scoring formula itself should not be adjusted frequently: each change resets the team’s intuition about what a given priority level means. Document the formula, review it quarterly, and change it only when the business’s priorities genuinely shift.
- Track closure and repeat incidents (root-cause backlog) — An exception that is resolved but recurs three weeks later is a symptom of a deeper structural problem. Track every exception closure with a short resolution note and automatically flag any KPI that breaches its threshold more than twice in a rolling 30-day window as a candidate for the root-cause backlog. The backlog is reviewed monthly by the data and operations teams together to identify and fix the underlying causes—pipeline instability, bad source data, or a flawed business process—rather than treating each recurrence as a fresh incident.