KPIs drift when definitions change silently—new channels, new exclusions, altered joins, or edits inside dashboards. You prevent drift by implementing KPI ownership, versioned releases, regression tests, and a monthly KPI integrity review.
Why KPI drift happens (real-world triggers)
KPI drift is almost never intentional. It is the cumulative result of legitimate business changes that nobody thought to propagate to the metrics layer—and of small, undocumented edits that seem harmless at the time but compound over months into significant divergence. Understanding the triggers is the first step to building a system that catches them.
- New channels (marketplaces, regions, new SKUs) — When the business launches on a new marketplace, opens a new geographic region, or introduces a new product line, the underlying transaction data changes shape. Revenue from the new channel may use different order statuses, different currency codes, or different fulfilment logic. If the KPI definition is not updated to explicitly include or exclude the new channel, the metric silently changes meaning: “total revenue” now means something different than it did last quarter, and year-on-year comparisons become unreliable without anyone flagging the break in the series.
- Changing cancellation/return policies — A policy change—extending the return window from 30 to 60 days, or changing how partial cancellations are recorded—alters the population of transactions that should be excluded from net revenue, conversion rate, and order fulfilment KPIs. If the KPI exclusion logic is not updated to reflect the new policy, the metric and the business reality diverge. This is particularly insidious because the data itself is correct; only the interpretation has changed, so no data quality alert will fire.
- M&A / restructuring changing hierarchies — Mergers, acquisitions, and internal restructurings routinely change the product hierarchy, the customer segmentation, the cost centre structure, or the regional reporting tree. A KPI broken down by “region” or “business unit” before the restructuring may use incompatible categories after it. Historical comparisons break silently if the dimension table is updated to reflect the new structure without preserving the old one—and the breakdowns in every dashboard that used the old hierarchy begin reporting different numbers with no obvious explanation.
- “Quick fixes” applied directly in dashboards — This is the most common and most dangerous trigger. An analyst notices that the revenue figure looks wrong and adjusts a filter directly in the dashboard to make it match the expected value—without documenting the change, updating the central definition, or notifying the KPI owner. The fix solves the immediate problem but creates a hidden divergence between this dashboard and every other report that still uses the original (unfixed) logic. Over time, a codebase of undocumented dashboard-level overrides accumulates, and the true definition of any given KPI becomes unknowable without reading the SQL inside each individual report.
- New data sources replacing old ones — When a legacy source system is replaced—a new CRM, a new ERP, a new e-commerce platform—the new system’s data model rarely matches the old one exactly. Field names change, status codes change, grain changes. If the ETL pipeline is updated to pull from the new source without carefully re-validating every KPI against the new schema, measures that appeared to migrate successfully may be computing against the wrong fields or missing transaction types that were present in the old system. The KPI values continue to update, but they are no longer measuring what they were designed to measure.
The anti-drift operating model (copy-paste)
No single control prevents KPI drift on its own. The model below works because each component addresses a different failure mode: the gold KPI set limits the surface area, owners create accountability, change requests create a paper trail, versioning enables rollback and comparison, regression tests catch unintended side effects, and the integrity review catches anything that slipped through. Together they form a closed loop.
- Gold KPI set: 10–20 leadership KPIs — Define and publish a curated list of the 10–20 KPIs that drive the most important business decisions and appear in leadership reviews. Any metric outside this set is an operational or analytical metric—useful, but not subject to the full governance process. Keeping the gold set small is essential: governance overhead grows with every KPI added, and an ungoverned long tail of “almost gold” metrics defeats the purpose. The gold set is the thing that must be right, always.
- Owners: one approver per KPI — Every gold KPI must have a single named business owner—the most senior person in the function the metric measures—who is the sole authority for approving changes to the definition. The owner is not a data engineer; they are the business stakeholder who would be most affected if the metric changed without their knowledge. Without a named owner, change requests have no one to approve or reject them, and the governance process collapses into a rubber stamp. The owner list should be reviewed quarterly as people change roles.
- Change requests: every change logged — Any modification to a gold KPI—changing a filter, updating an exclusion, altering the date logic, swapping a source field—must be submitted as a formal change request before it is implemented. The request documents what is changing, why, which dashboards will be affected, and who approved it. This creates an auditable history that answers the most frequent post-incident question: “when did this metric change and why?” Even a lightweight process (a PR template and a Slack message to the owner) is infinitely better than no process.
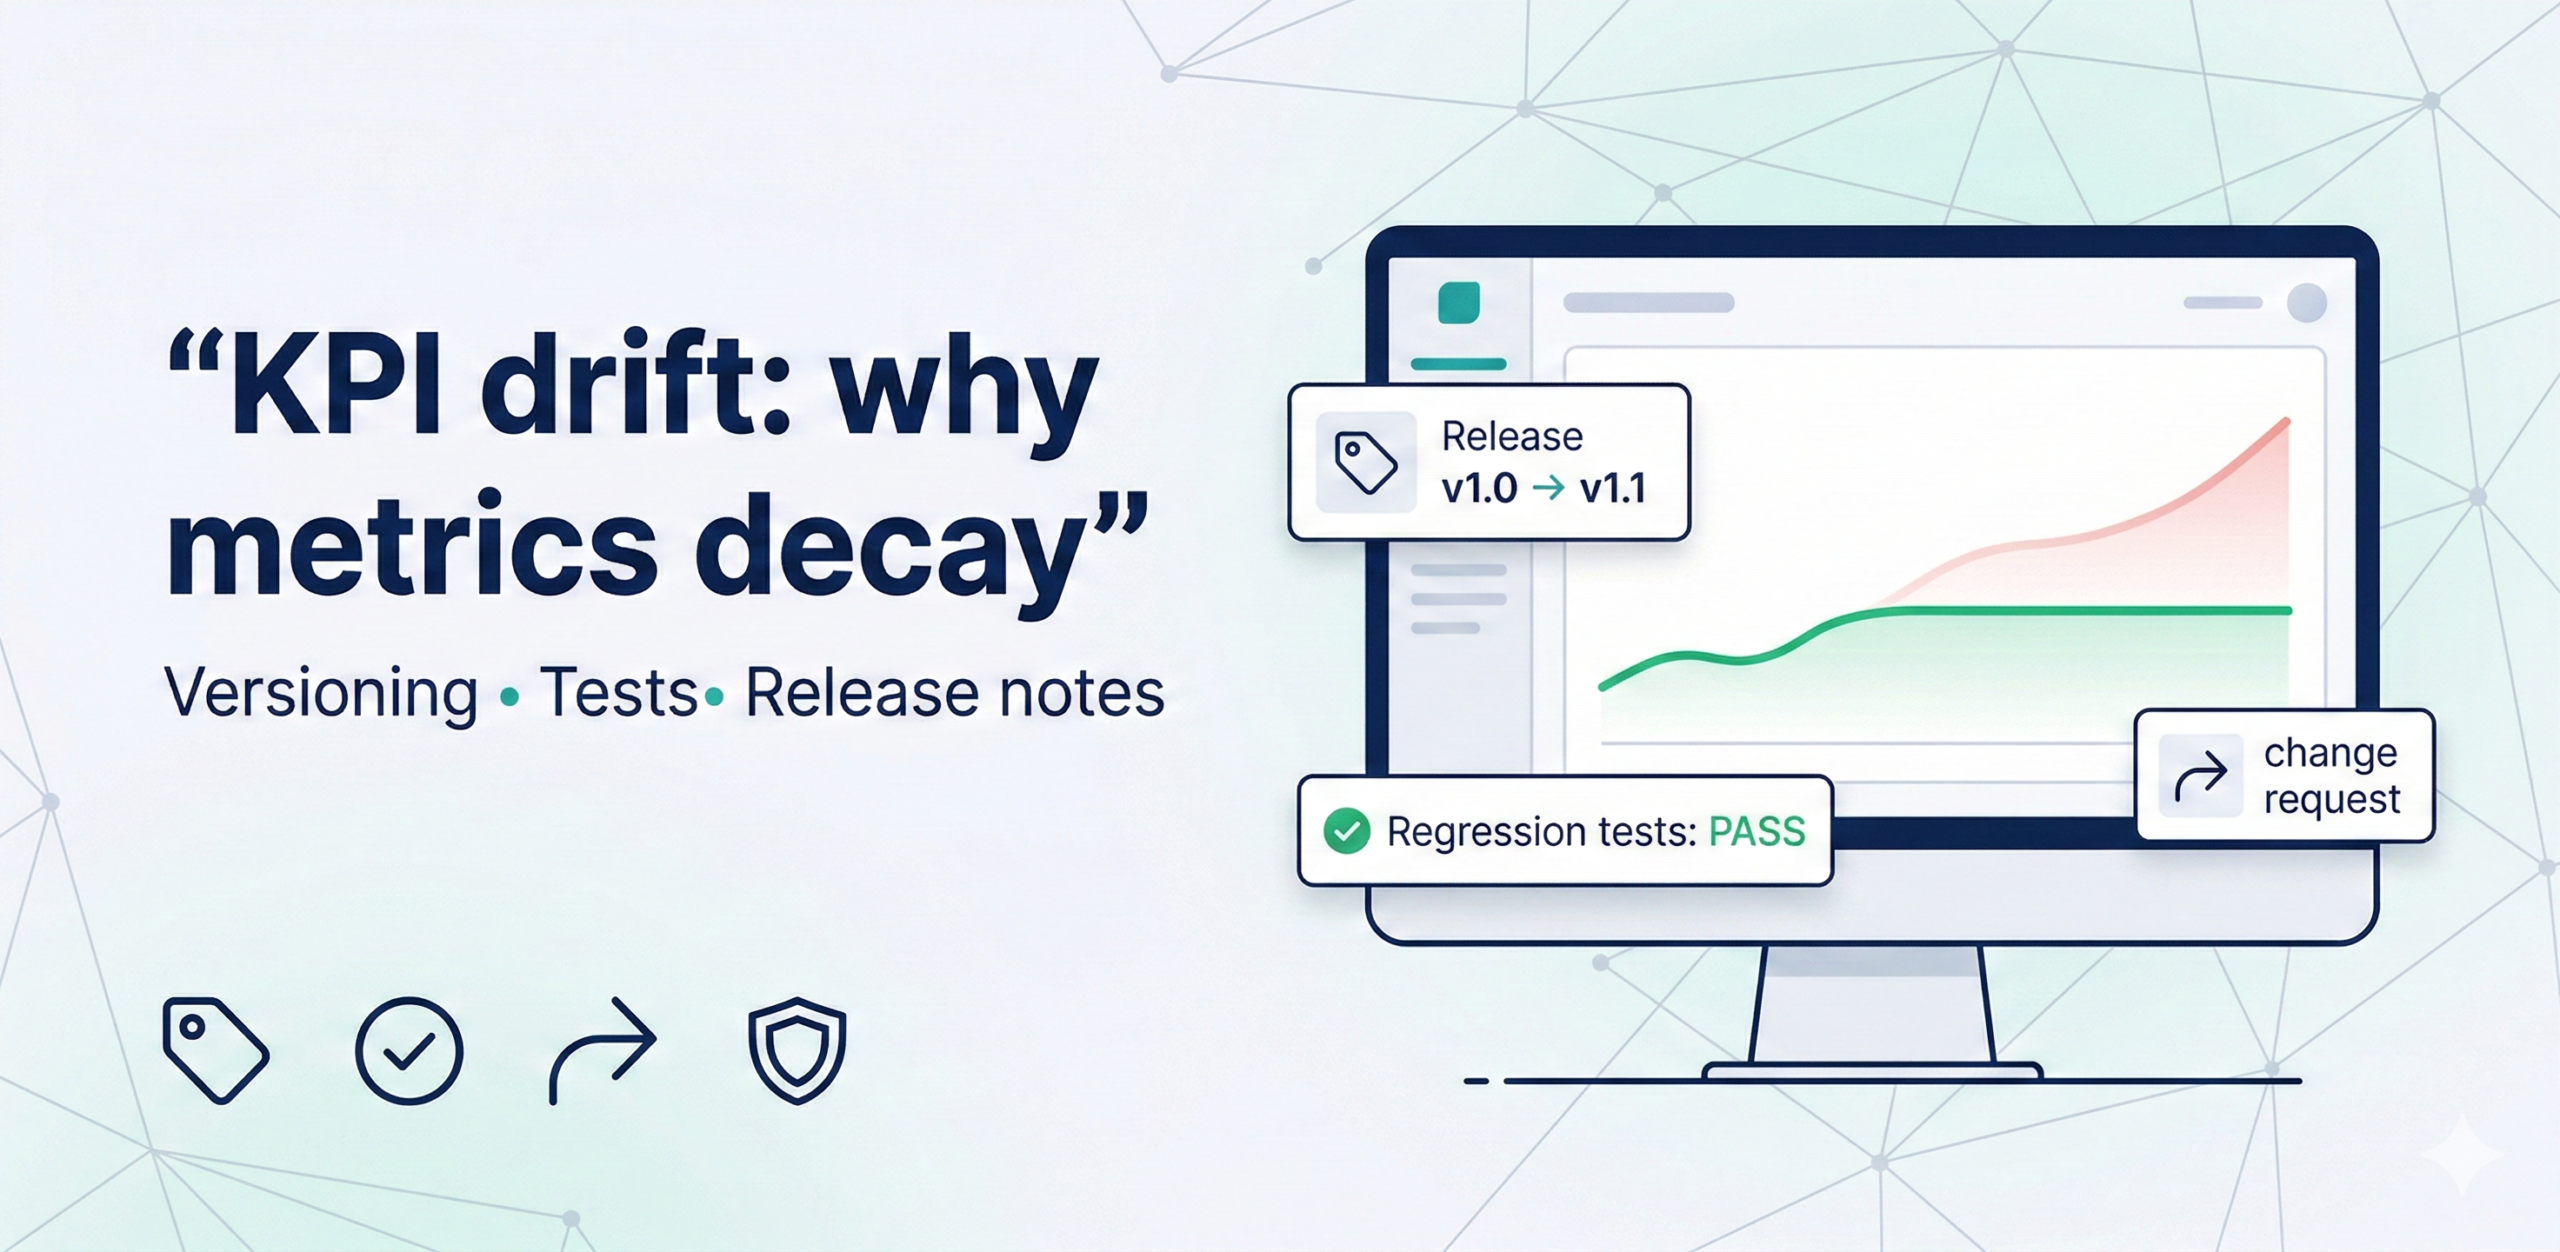
- Versioning: v1.0 → v1.1 with effective dates — Each approved change to a gold KPI produces a new version, tagged in version control (e.g., v1.0 → v1.1) with the effective date from which the new definition applies. The effective date is critical for time-series integrity: it tells analysts and consumers exactly where in the historical record the methodology changed, so they can correctly interpret trends that span the version boundary. Release notes accompanying each version should describe the change in plain language, not just in SQL, so non-technical stakeholders can understand what shifted and why.
- Regression tests: for all gold KPIs — After every deployment that touches the data model or the measures layer, an automated test suite compares the current computed value of each gold KPI against a known-good baseline for a fixed reference period. If the delta exceeds a defined tolerance (e.g., ±1%), the test fails and blocks the deployment. Regression tests are the technical safety net that makes the change process trustworthy: owners can approve changes confidently knowing that any unintended side effects—a broken join, a misapplied filter, an unexpected NULL—will be caught before they reach production dashboards.
- Monthly integrity review: what changed, what broke, what improved — A structured monthly review—30–45 minutes with the data lead and key KPI owners—that walks through three questions for each gold KPI: Did the value change significantly relative to the prior period? Was any change request processed this month, and did the version update behave as expected? Did any regression test flag an issue, and was it resolved? This ritual is what catches the drift that technical controls miss: business-context changes (like a new return policy) that do not trigger any automated alert but do change the meaning of the metric.
MVP (3–5 weeks)
This plan builds the anti-drift model incrementally, starting with the highest-leverage controls first. By the end of week three the most critical safeguards are in place; weeks four and five add the review ritual and the dashboard layer that make the model visible to stakeholders.
- Week 1: establish gold KPI set + owners — Run a scoping session with the data lead and business stakeholders to agree which 10–20 metrics constitute the gold KPI set. For each KPI, document the current definition (grain, date logic, exclusions, source table) in a KPI contract template and confirm the named business owner who will approve future changes. Surface any existing definitional disagreements now—this is the moment to resolve them, not after the governance process is in place and a change request is being contested.
- Week 2: define change workflow + versioning — Design and document the change request process: the PR template for KPI definition changes, the required sign-off from the KPI owner, and the version tagging convention (vX.Y with effective date). Communicate the process to all teams who currently build or maintain dashboards. Add a CHANGELOG file to the metrics repository and backfill it with the current version of each gold KPI as v1.0. From this point forward, every change to the gold set must go through the process.
- Week 3: regression tests + release notes template — Write the regression test suite: for each gold KPI, a test that computes the metric for a fixed reference period and asserts the result is within tolerance of the known-good baseline. Add the tests to the CI pipeline so they run automatically on every pull request that touches the measures layer, fact tables, or conformed dimensions. Create a release notes template that the data team completes for every versioned KPI change—a short document covering what changed, why, the effective date, and which dashboards are affected.
- Week 4–5: monthly integrity review cadence + dashboards — Schedule the first monthly integrity review and run it with the data lead and KPI owners. Use the session to walk through the gold KPI set, confirm all definitions are current, and review any regression test failures or change requests from the previous month. Build a simple internal integrity dashboard that displays the pass/fail status of all regression tests, the version history of each gold KPI, and any open change requests—giving the data team a single place to monitor the health of the metrics layer between monthly reviews.