Decision-grade analytics is analytics leaders can act on without debating definitions—because KPIs are governed, data is monitored, and dashboards are built around decisions.
Direct answer
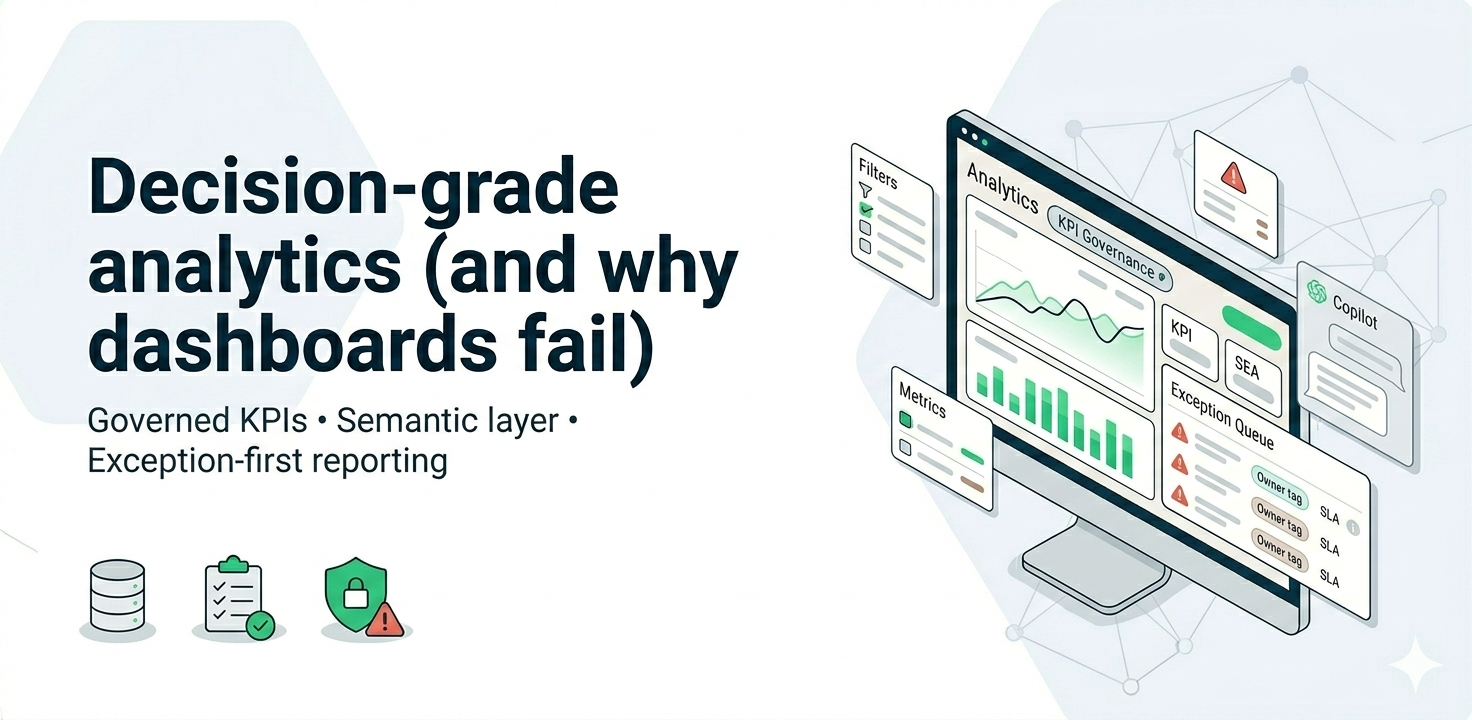
Decision-grade analytics is analytics that leaders can use weekly to make decisions without arguing about numbers—because KPIs are defined once, governed, and continuously monitored. Dashboards fail when metric logic changes across teams, data freshness isn’t operationalized, and reporting isn’t tied to owners and actions.
Why dashboards fail (even when the visuals look great)
Most dashboards don’t fail because of design. They fail because the system behind them isn’t built for trust and repeatable decision-making.
- Multiple versions of the truth
The same KPI (revenue, margin, EAC, fill rate) gets calculated differently across teams due to different filters, date logic, exclusions, and grain. - No KPI contract / semantic layer
Without a single “definition layer,” teams rebuild logic inside each report, which guarantees drift and disputes over time. - Freshness and data quality aren’t operationalized
If refresh delays, missing data, or anomalies aren’t visible, users stop trusting dashboards—even when the numbers are technically correct. - Dashboards aren’t built around decisions
Dashboards show charts, but don’t answer: “What needs action this week?” Without thresholds and next actions, adoption drops.
What “decision-grade” actually includes (minimum viable)
Decision-grade does not mean perfect data. It means your analytics is predictable, governed, and operational—so leaders can act with confidence.
- KPI hierarchy: North Star → driver KPIs → operational KPIs
- Semantic layer: definitions, controlled measures, consistent filters, documented logic
- Quality + freshness monitoring: alerts, thresholds, and an incident workflow
- Role-based dashboards: executive view vs operator view (different purposes)
- Operating cadence: weekly review, named owners, actions, escalation rules

The fastest MVP approach (4–6 weeks) to fix trust and adoption
You don’t need a full rebuild to become decision-grade. Start with one decision domain, ship a governed KPI layer, and design the dashboard for action.
Step 1: Pick one decision domain (and keep it scoped)
Examples:
- Construction: project controls (budget vs actual vs committed, change exposure, EAC)
- Retail: inventory health + discount leakage
- Manufacturing: downtime + throughput constraints
Step 2: Define the “gold KPI set” (10–15 KPIs) and owners
Define: KPI name, formula, grain, exclusions, and owner. If you can’t assign ownership, adoption will stall.
Step 3: Build the semantic layer first
Create reusable measures and standard dimensions. Lock time logic (order date vs ship date vs invoice date), returns/cancellations handling, and currency treatment.
Step 4: Build exception-first views
Instead of showing everything, show what requires action:
- Thresholds (warning/breach)
- Owner
- Suggested next step
- Drilldown path
Step 5: Add monitoring (so trust compounds over time)
At minimum:
- Freshness checks (did the data arrive on time?)
- Completeness checks (did expected volume arrive?)
- Anomaly checks (did a KPI swing beyond expected bounds?)
Step 6: Establish the weekly decision cadence
Short weekly review: exceptions → actions → owners → deadlines. Track closure.
How to measure success (so it’s not just “more dashboards”)
- Metric disputes reduce: fewer meeting minutes spent debating numbers
- Decision velocity improves: time-to-detect and time-to-act decreases
- Adoption increases: repeat usage (weekly active viewers) rises
- Manual reporting drops: fewer spreadsheets and ad-hoc extracts
- KPI stability improves: fewer ungoverned edits and redefinitions
Optional “starter metrics” (small list):
- Dashboard weekly active users (WAU)
- of exceptions resolved per week
- Data freshness SLA compliance %
- Hours of manual reporting saved per month
Common mistakes to avoid
- Rebuilding the platform before fixing KPI definitions
- Writing KPI logic inside each report (guaranteed drift)
- No thresholds or owners → dashboards become passive
- No monitoring → trust decays after the first incident
- Trying to boil the ocean instead of shipping one domain MVP